Master Market Momentum with the Relative Strength Oscillator (RSO)
In the fast-paced world of technical analysis, traders are constantly seeking tools that can accurately gauge the internal strength of a price move. The Relative Strength Oscillator (RSO) is a powerful momentum utility designed for MetaTrader 4 (MT4) and MetaTrader 5 (MT5) that provides a clear, oscillating view of market sentiment. By transforming raw price data into a normalized momentum scale, the RSO helps traders identify high-probability entry and exit points with precision.
The Anatomy of the Relative Strength Oscillator
The RSO is a variation of the classic Relative Strength Index (RSI), but with a critical difference: it oscillates around a central zero line. This makes it significantly easier to visualize whether the bulls or bears are currently in control of the market.
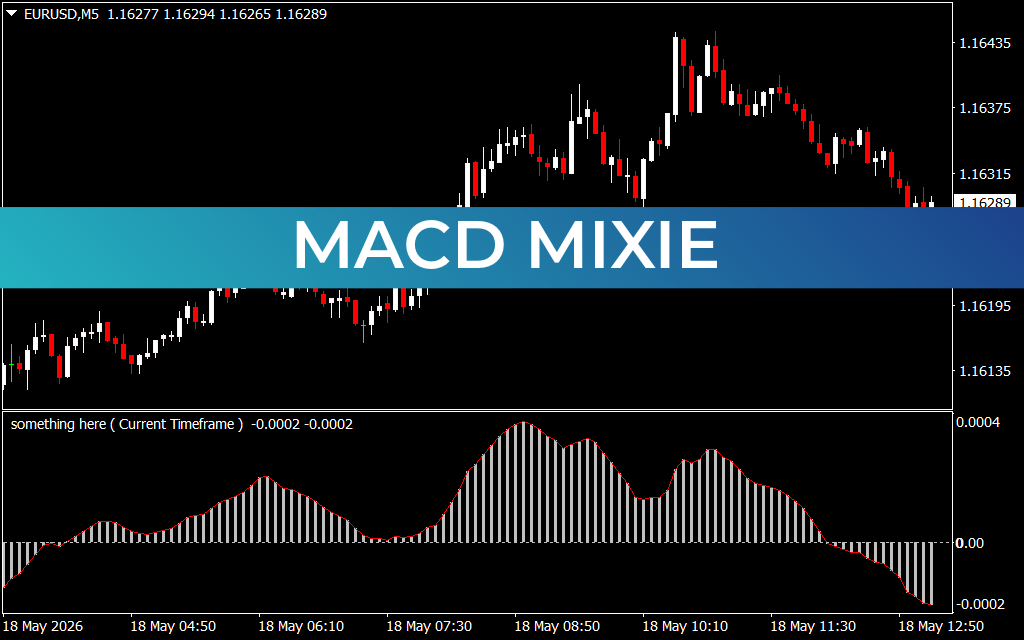
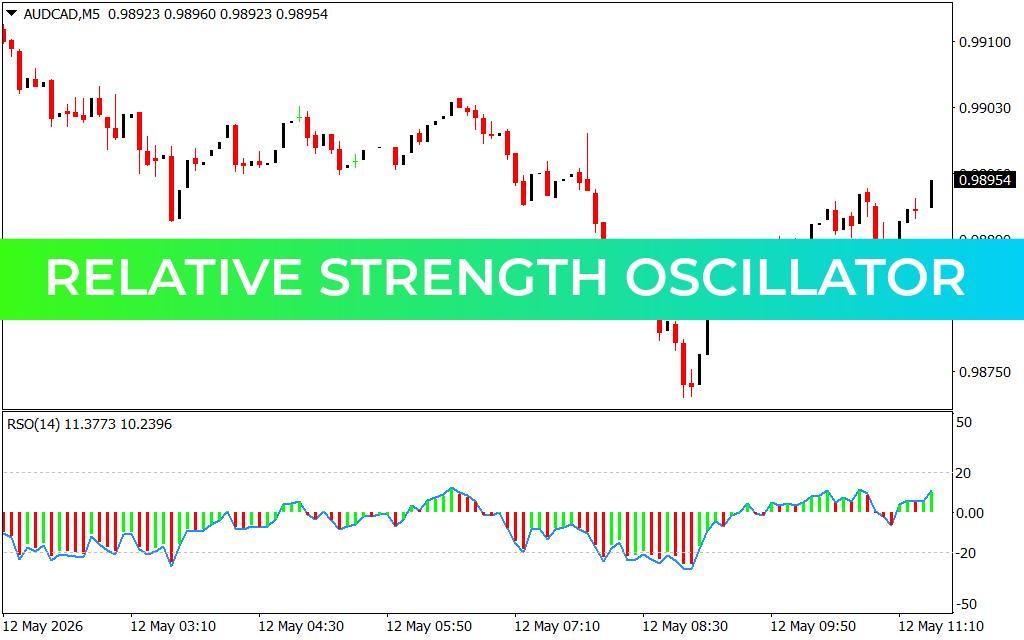
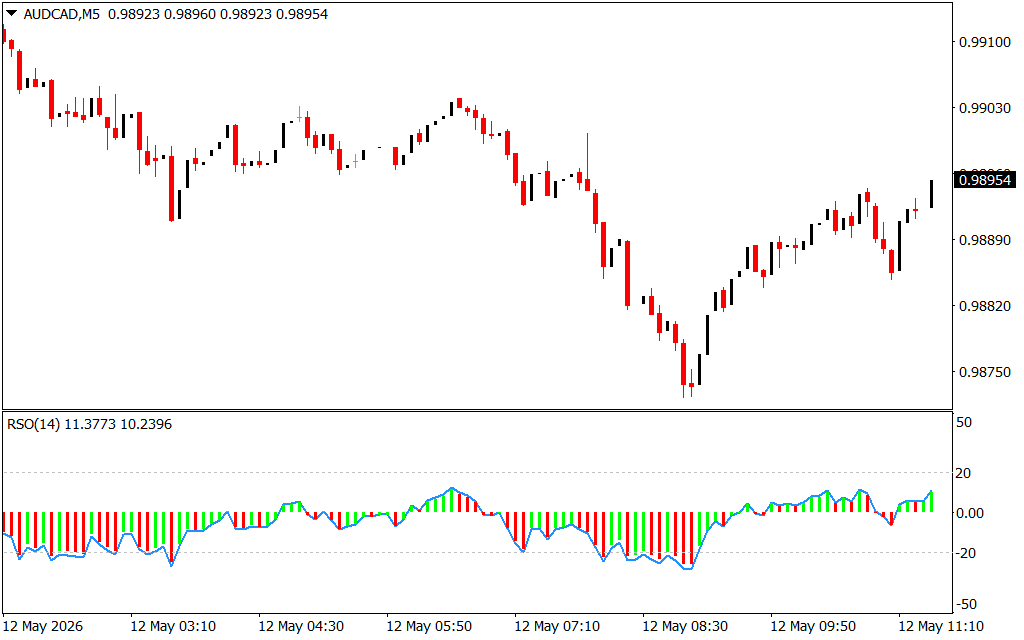
As displayed in the AUD/CAD M5 chart, the indicator is plotted in a sub-window and consists of a dynamic histogram paired with a signal line.
- Positive Values (Green/Blue): When the oscillator is above the zero line, it indicates bullish momentum. The strength of the trend is reflected by the height of the bars.
- Negative Values (Red): When the oscillator dips below the zero line, bearish momentum is dominant, signaling potential selling opportunities.
- The Zero-Line Crossover: This is the most fundamental signal. A cross from negative to positive suggests a shift toward bullish sentiment, while a cross from positive to negative indicates a bearish transition.
Strategic Advantages for Intraday Trading
For traders focused on lower timeframes like the M5, the RSO offers several tactical benefits:
- Identifying Overextended Conditions: Like the RSI, the RSO features overbought and oversold thresholds (typically at +20 and -20). When the histogram reaches these extremes, as seen in the provided AUD/CAD example, it warns of a potential price exhaustion and an impending reversal.
- Momentum Divergence: One of the most powerful uses of the RSO is spotting divergences. If price makes a new high but the RSO makes a lower high, it signals that the trend is losing strength, providing an early warning to tighten stop-losses or exit positions.
- Visual Clarity: The color-coded histogram provides an at-a-glance understanding of market velocity, allowing traders to quickly filter out "weak" moves that lack genuine institutional backing.
- Smoothing Market Noise: The RSO’s internal smoothing algorithm helps to eliminate the minor price "wiggles" that often trigger false signals in more sensitive indicators.
Integration and Execution
The Relative Strength Oscillator is most effective when used as a momentum filter within a broader trading system. For example, a trader might wait for price to hit a major support level and then look for the RSO to cross back above the zero line as a "trigger" to enter a long position.
In the provided M5 chart, the RSO successfully captures the recovery phase, with the histogram turning green as price begins its upward trajectory. By integrating this tool into your MT4 or MT5 setup, you gain a mathematical edge that helps you trade in harmony with market momentum, ensuring that you only commit capital when the strength of the move is in your favor.
1 Download
Last Update:
May 12, 2026 14:32 PM
Published:
Jan 23, 2026 17:45 PM
Category: