Master Structural Momentum and Overbought Levels with the RMI Indicator for MT5
In modern financial markets, executing consistent entries requires technical tools that can accurately isolate underlying asset velocity while ignoring minor market noise. For years, the Relative Strength Index (RSI) has served as an industry-standard benchmark for identifying overbought and oversold thresholds. However, classic oscillators frequently struggle during prolonged, aggressive trend expansions, trapping day traders and scalpers into premature reversal entries. For high-velocity environments like the EUR/USD pair, a more structural momentum framework is required. The RMI Indicator for MT5 updates traditional oscillator mechanics to solve this exact problem.
What is the RMI Indicator for MT5?
The RMI (Relative Momentum Index) indicator is an advanced technical analysis oscillator engineered specifically for the MetaTrader 5 platform. Originally developed by Roger Altman, the RMI was designed to improve upon standard RSI behavior by substituting simple day-to-day price close differentials with a flexible momentum lookback parameter.
While a traditional RSI only calculates price changes between the current candle close and the immediate previous candle close, the RMI introduces a secondary variable: a customizable momentum interval (typically set to a 3-to-5 period lookback). By measuring price variance across a broader time window instead of relying strictly on individual bars, the index filters out localized volatility spikes. This allows you to track macro institutional velocity with far greater precision and smooth out standard trading grids.
Key Visual Features and Technical Advantages
- Upgraded Data Smoothing: By incorporating a multi-bar momentum lookback alongside traditional exponential smoothing, the system delivers highly stable technical signals that resist minor intraday market noise.
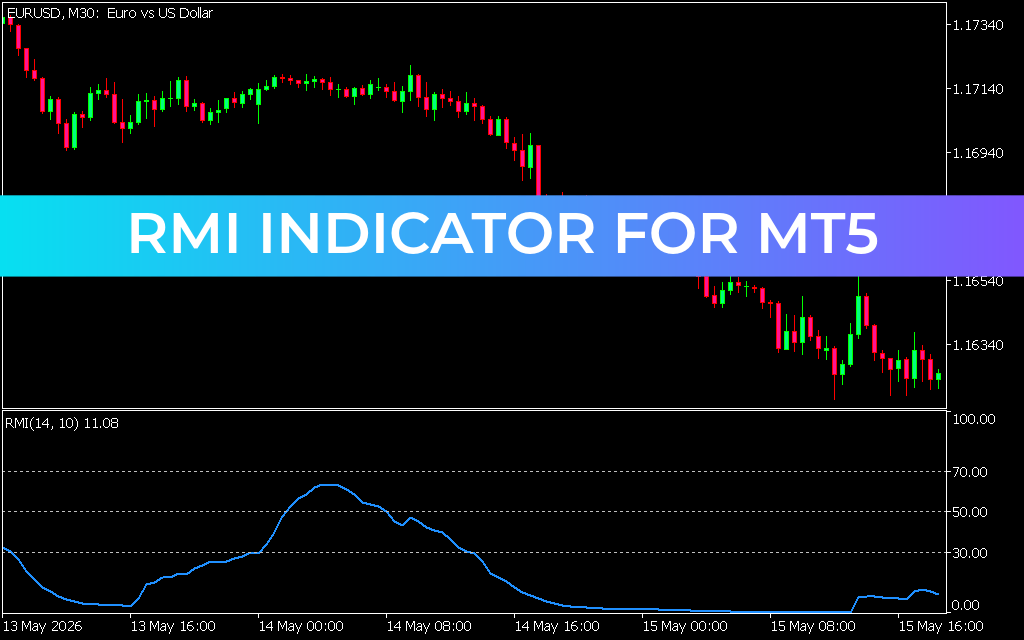
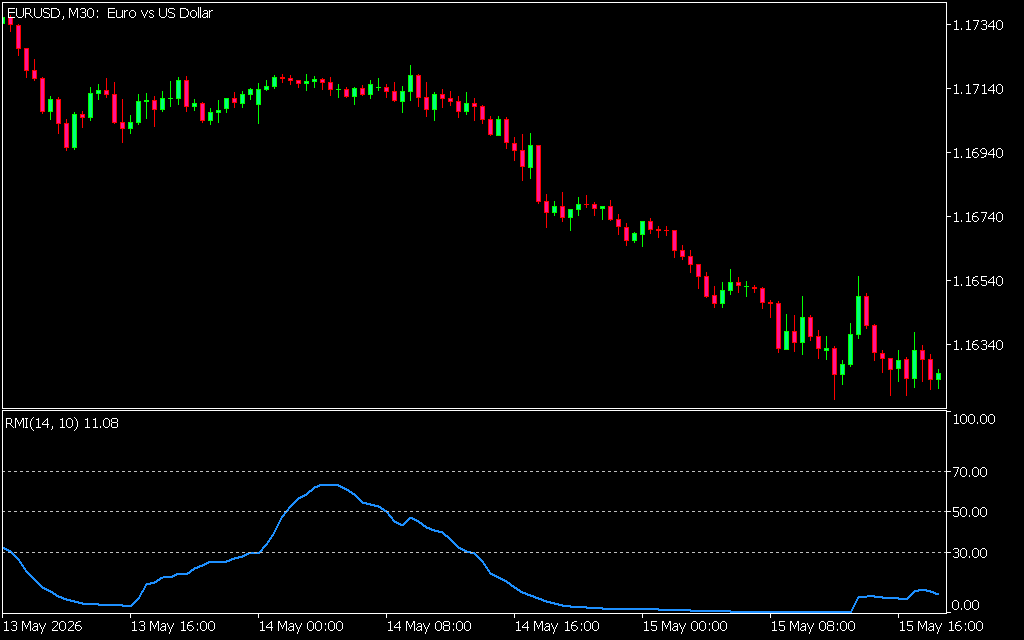
- Objective Exhaustion Boundaries: The oscillator operates inside a fixed scale from 0.00 to 100.00. It features clear horizontal threshold markers at the 30.00 and 70.00 (or 20.00 and 80.00) levels to map major oversold floors and overbought ceilings.
- Multi-Timeframe Structural Clarity: As displayed on liquid intraday setups like the 30-minute (M30) chart, the indicator line moves smoothly, enabling swing analysts to spot underlying momentum trends before price reverses.
- Clean Sub-Window Workspace: Running the entire multi-layered formula inside a separate panel directly underneath your terminal keeps your primary screen uncluttered, leaving room to map manual support blocks, supply zones, or trend channels.
How to Trade with the RMI Indicator for MT5
Maximizing your edge with this upgraded indicator involves utilizing its extreme boundary rejections to time structural mean-reversion pullbacks.
- Short Entry Setups (Overbought Rejections): Monitor the asset as it rallies toward an established historical resistance ceiling. If the RMI line surges above the 70.00 threshold into overbought territory and subsequently hooks back downward, buyer exhaustion is confirmed. Execute a short entry at the candle close to capture the downward correction.
- Long Entry Setups (Oversold Bounces): Conversely, when price drops cleanly into an institutional order block and the oscillator line sinks below the 30.00 boundary, the market is oversold. Wait for the signal line to turn back upward and cross out of the lower extreme to trigger a high-probability long position.
Upgrade your current trading strategy by downloading the RMI Indicator for MT5 today to trade with systematic focus.
3 Downloads
Last Update:
May 19, 2026 17:08 PM
Published:
Jan 19, 2026 19:31 PM
Category: