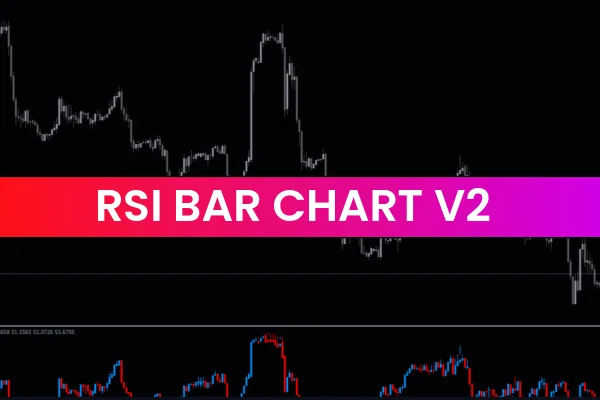
The RSI Bar Chart V2 Indicator MT4 is a powerful yet easy-to-use Forex Indicator designed for traders who want a clearer and more visual way to analyze market momentum. Built for the MetaTrader 4 platform, this free indicator transforms traditional RSI values into a bar chart format, allowing traders to quickly identify trend direction, momentum strength, and potential entry or exit points.
By visualizing RSI data in bars rather than a standard line oscillator, the RSI Bar Chart V2 Indicator MT4 improves readability and helps traders react faster to changing market conditions.
What Is the RSI Bar Chart V2 Indicator
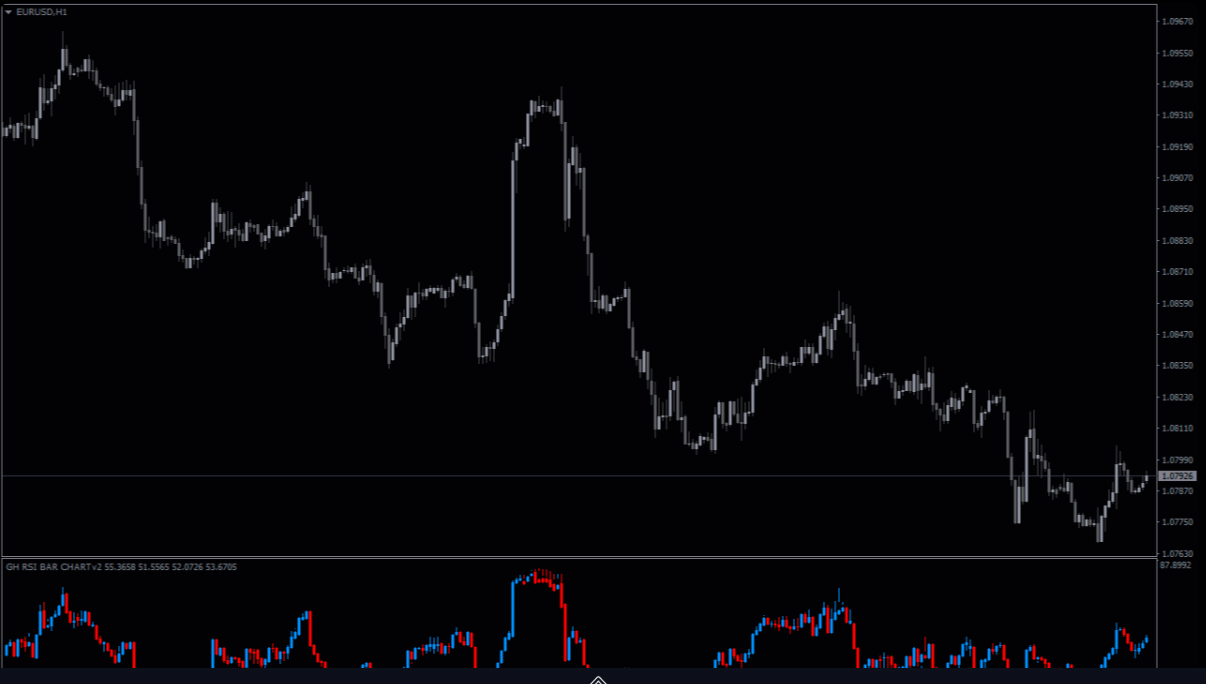
The RSI Bar Chart V2 Indicator is based on the Relative Strength Index (RSI), a widely used momentum oscillator. Instead of plotting RSI as a line in a separate window, this indicator displays RSI values as colored bars, making it easier to interpret strength and weakness in price movements.
This visual approach is especially helpful for traders who prefer quick decision-making and clean chart analysis.
How the Indicator Works
The RSI Bar Chart V2 Indicator MT4 calculates RSI values using standard RSI formulas and then converts those values into a bar-based display.
Key Features
Displays RSI values as bars
Highlights momentum changes clearly
Works on all MT4 timeframes
Suitable for all currency pairs
Lightweight and fast-performing
The bars expand or contract based on RSI strength, giving traders an instant snapshot of market momentum.
Identifying Overbought and Oversold Conditions
One of the main benefits of the RSI Bar Chart V2 Indicator MT4 is its ability to clearly show overbought and oversold zones.
Overbought Market Conditions
RSI bars reach upper extreme levels
Buying momentum may be weakening
Potential sell or profit-taking zone
Oversold Market Conditions
RSI bars drop to lower extreme levels
Selling pressure may be exhausting
Possible buying opportunity
This visual clarity makes it easier to spot reversal zones without overanalyzing Price Action.
Using RSI Bar Chart V2 for Trend Analysis
Beyond reversals, the RSI Bar Chart V2 Indicator MT4 is highly effective for trend confirmation.
Rising RSI bars indicate bullish momentum
Falling RSI bars signal bearish momentum
Consistent bar direction confirms Trend Strength
Traders can use this information to stay aligned with the dominant market trend and avoid low-probability countertrend trades.
Trading Strategies with RSI Bar Chart V2 Indicator
The indicator can be applied to multiple trading strategies.
Momentum Trading Strategy
Enter buy trades when RSI bars rise from oversold zones
Enter sell trades when RSI bars fall from overbought zones
Confirm entries with price action
Trend Confirmation Strategy
Trade in the direction of RSI bar momentum
Avoid trades when bars fluctuate sideways
Combine with moving averages or trend indicators
These strategies help traders improve accuracy and consistency.
Customization and Settings
The RSI Bar Chart V2 Indicator MT4 allows traders to customize:
RSI period length
Bar colors
Overbought and oversold levels
This flexibility enables traders to adapt the indicator to different timeframes, trading styles, and personal preferences.
Best Timeframes and Markets
The RSI Bar Chart V2 Indicator MT4 works effectively on:
M5 and M15 for Scalping
M30 and H1 for intraday trading
H4 and D1 for swing trading
It can be used on forex pairs, indices, and other MT4-supported instruments.
Advantages of RSI Bar Chart V2 Indicator MT4
Free and beginner-friendly
Clear visual momentum analysis
Reduces chart clutter
Improves speed of decision-making
Works in trending and ranging markets
Its bar-based design makes RSI interpretation more intuitive and trader-friendly.
Conclusion
The RSI Bar Chart V2 Indicator MT4 is an excellent momentum and trend analysis tool for forex traders who prefer clear, visual signals. By converting traditional RSI values into an easy-to-read bar chart, it helps traders identify overbought and oversold conditions, confirm trends, and make more confident trading decisions.
👉 Visit IndicatorForest.com to explore more free MT4 indicators, advanced trading tools, and expert forex guides to elevate your trading performance.
FAQ
Published:
Dec 20, 2025 12:28 PM
Category: