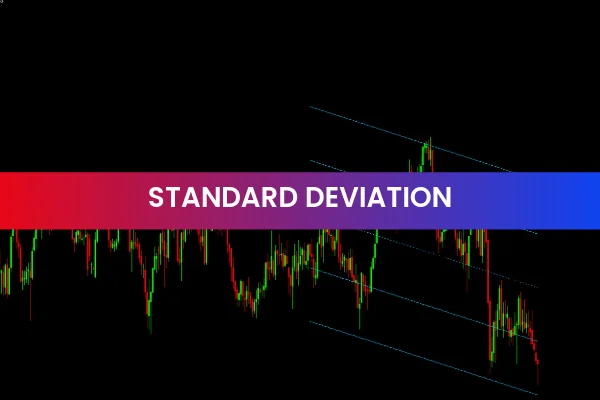
The Standard Deviation Channel Indicator is a free and popular Forex tool for MT4 traders that helps identify potential price breakouts. By analyzing the standard deviation of price movements, this indicator provides visual channels around the average price, allowing traders to detect breakout opportunities and make informed trading decisions.
How the Standard Deviation Channel Indicator Works
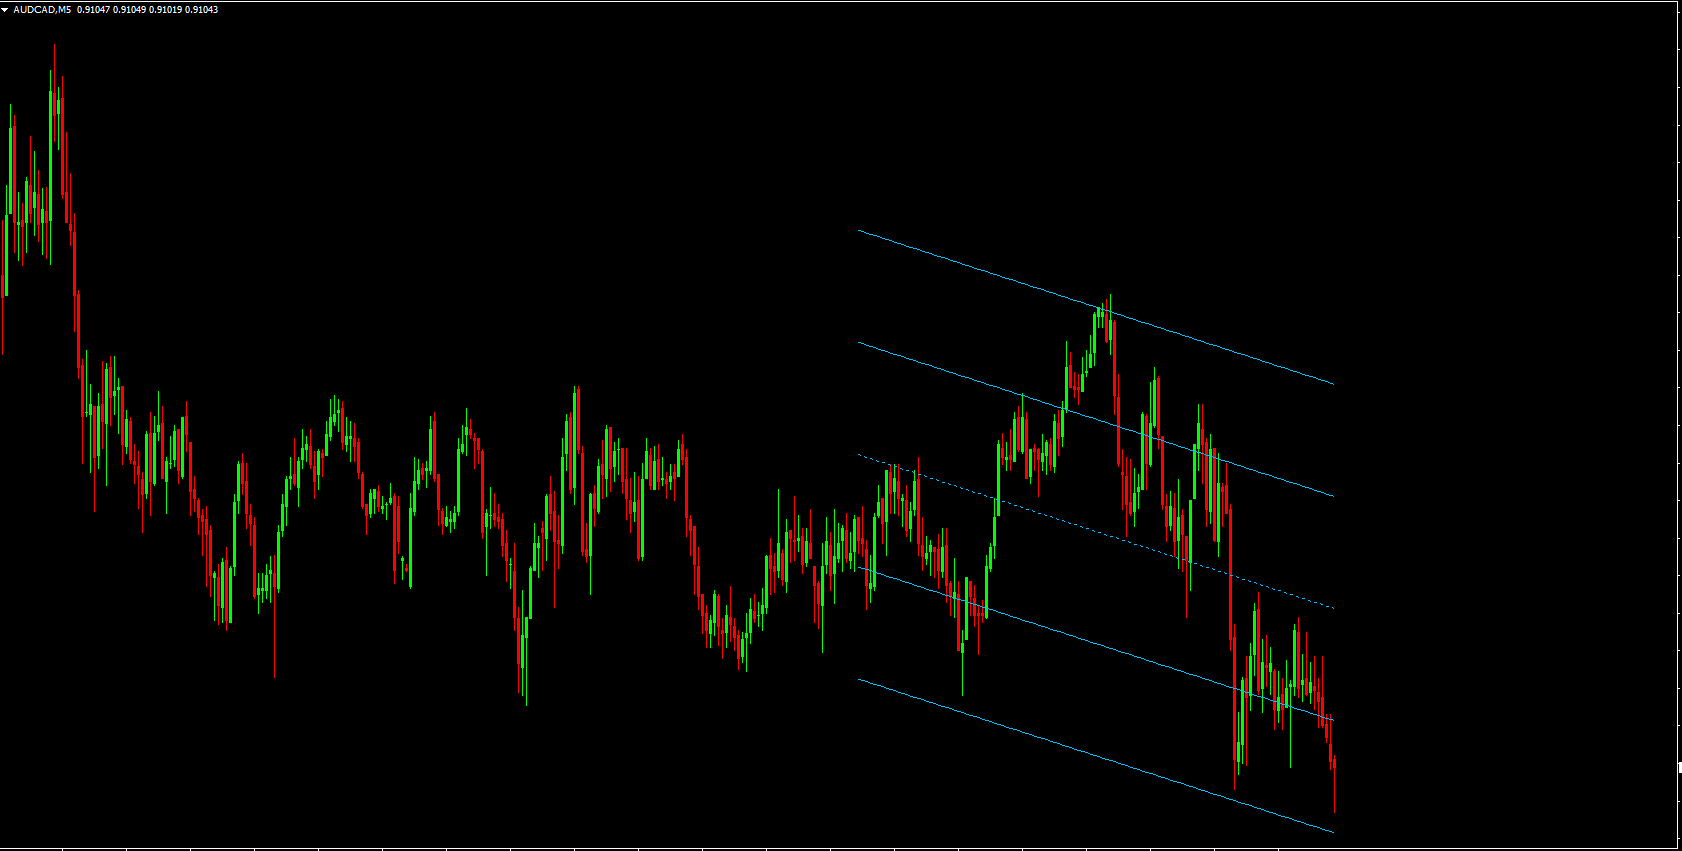
The indicator calculates the average price of a currency pair over a defined period and then determines the standard deviation of price movements. It then plots an upper and lower channel around the average price. When the price moves outside of these channels, it signals a potential breakout, helping traders identify promising entry and exit points.
Key Features
Upper and Lower Channels: Visualize the range of price deviations from the average.
Breakout Detection: Alerts traders when the price moves beyond the channels.
Technical Analysis Tool: Complements other indicators to confirm trends or reversals.
Customizable Periods: Adjust the averaging period and deviation settings to fit trading strategies.
Easy Visualization: Helps traders quickly spot market opportunities on MT4 charts.
Benefits of Using the Standard Deviation Channel Indicator
Identify Breakouts Early: Spot potential trend continuations or reversals before they fully develop.
Optimize Entry and Exit Points: Trade with higher accuracy using channel boundaries.
Supports Risk Management: Helps set stop-loss and take-profit levels based on market volatility.
Versatile: Works across all currency pairs and timeframes.
User-Friendly: Easy to interpret, suitable for both beginner and experienced traders.
The Standard Deviation Channel Indicator is an essential MT4 tool for traders aiming to capitalize on price breakouts. By providing clear upper and lower channels and highlighting potential breakout zones, it enhances trading strategies and improves decision-making.
Enhance your breakout trading with the Standard Deviation Channel Indicator. Visit IndicatorForest.com to download this f
FAQ
It plots a central average price line with upper and lower bands spaced by a multiple of standard deviation. These channels show how far price typically strays from its mean over the chosen period.
It draws an average price line with upper and lower bands based on standard deviation, creating a channel that reflects typical price variation. Moves outside this channel can signal potential breakouts or extremes.
When price closes convincingly outside the upper or lower band, it can signal a volatility expansion and possible breakout move. Traders may enter in the direction of the break, often with confirmation from momentum or volume.
Yes. In ranging markets, touches of the outer bands can mark overextended prices that may revert toward the middle line. This approach requires strict risk management, especially if a strong trend develops.
Yes. In quieter markets, price touching or briefly exceeding a band and then turning back can present mean‑reversion opportunities, especially when supported by reversal patterns or divergences.
It is effective from intraday charts up to weekly charts. Higher timeframes tend to offer smoother channels and fewer false breaks.
You can change the lookback period and the number of standard deviations used. Longer periods and larger deviations create wider, slower‑moving channels, while shorter settings make the channel tighter and more reactive.
Shorter periods and smaller deviations create tight channels that react quickly but trigger more frequent signals; longer periods and larger deviations respond more slowly but focus on major moves. Adjust them to match your strategy and the volatility of the pair.
Trend indicators, oscillators and support/resistance analysis all help you decide whether a band touch is likely to lead to continuation or reversal. Combining them improves decision quality.
Published:
Dec 17, 2025 12:52 PM
Category: