Master Momentum Trading with the CCI Woodies Patterns V1 Indicator
In technical analysis, mastering intraday momentum requires separating genuine trend accelerations from localized market noise. Many retail traders depend on lagging moving averages that offer late trade entries or standard oscillators that result in costly whipsaws during highly volatile sessions. The Commodity Channel Index (CCI), originally engineered by Donald Lambert and later refined by legendary trader Ken Wood, offers a robust solution. The CCI Woodies Patterns V1 indicator brings this classic institutional trading system to modern charting platforms, delivering a highly visual framework to spot high-probability momentum bursts.
Here is an in-depth analysis of how this technical system operates and how you can implement its algorithmic rules into your daily trading routine.
Decoding the CCI Woodies System Engine
The CCI Woodies Patterns V1 indicator calculates momentum velocity by measuring price deviations from its statistical average. Rather than overlaying confusing bands onto your primary candlesticks, the indicator operates cleanly within a dedicated sub-window below your chart workspace.
The software builds a comprehensive market-bias dashboard utilizing three core technical elements:
- The Continuous CCI Line: Tracks real-time price momentum. It oscillates rapidly around a central baseline to flag when an asset is experiencing an aggressive volume surge.
- The Zero-Line Anchor: The absolute center of the Woodies system. The zero-line acts as the core equilibrium floor. When the CCI line remains sustained above zero, it confirms institutional buying dominance; reading below zero indicates a structural markdown phase.
- The Multi-Color Histogram: Changes colors dynamically to map specialized technical chart patterns. It highlights specific trend conditions and exhaustion points, helping you read shifting market psychology at a single glance.
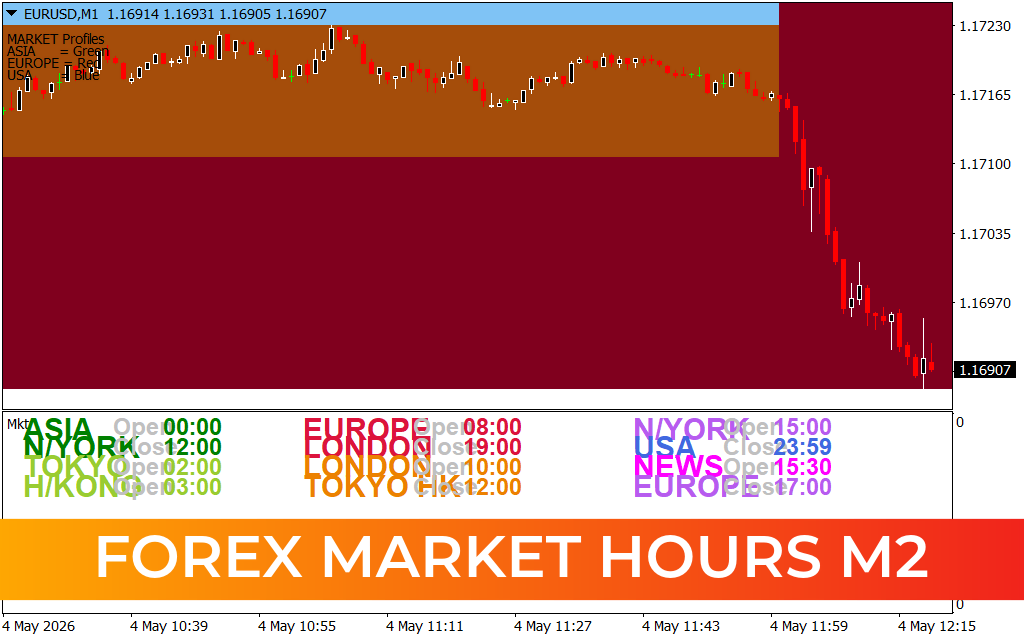
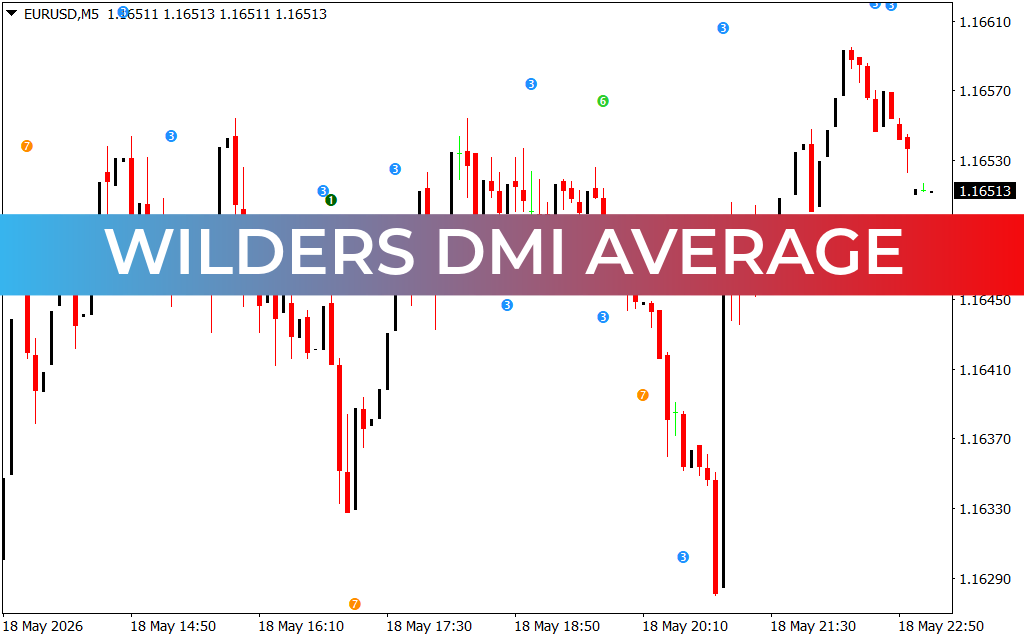
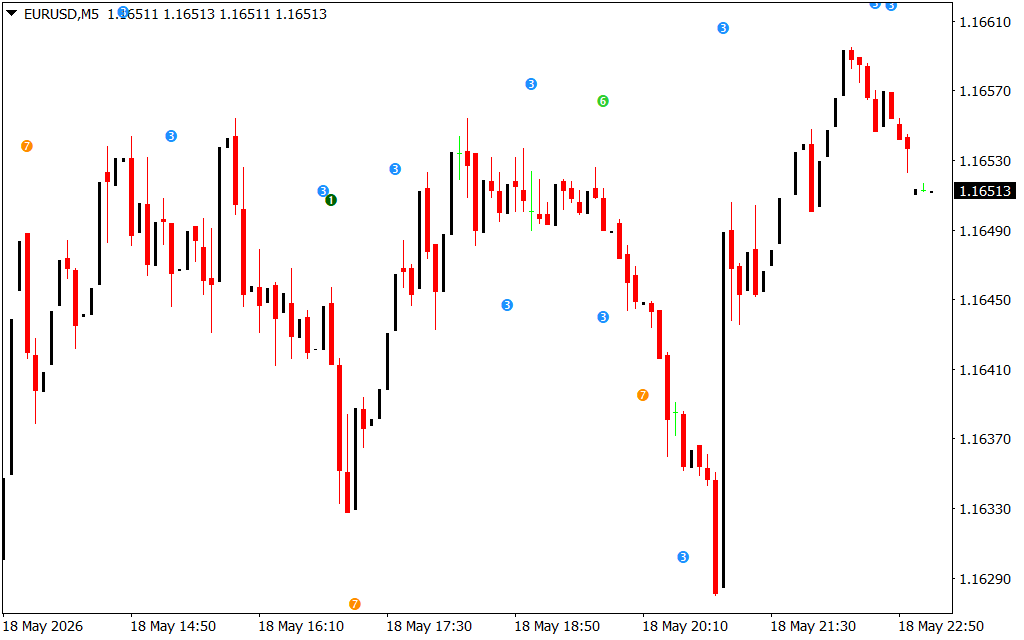
As shown on the EURUSD M5 chart, the indicator replaces erratic price bars with highly smoothed, intuitive historical waves. It automatically organizes fast-paced intraday variations into distinct bullish expansion zones and bearish distribution cycles.
Core Strategic Benefits for High-Frequency Scalpers
- Pre-Defined Momentum Patterns: The system is specifically engineered to look for classic Woodies setups, such as "Zero-Line Rejections" and "Trendline Breaks," removing emotional second-guessing from your strategy.
- Advanced Visual Smoothing: By utilizing custom historical smoothing calculations, it irons out minor spikes during low-liquidity sessions, preventing unnecessary stop-outs.
- Clean Candlestick Workspace: By shifting the core momentum logic to a separate sub-window, your primary chart remains clean and perfectly organized for raw Price Action analysis.
Practical Trading Rules and Execution Framework
To secure a strong statistical edge with the CCI Woodies Patterns V1 indicator, use these two core execution methodologies:
- The Zero-Line Rejection (ZLR) Entry: In a strongly established uptrend where the histogram is consistently green, wait for a brief counter-trend pullback. If the CCI line retraces toward the zero baseline but bounces off it cleanly to head back upward, a valid ZLR pattern is triggered. Execute a buy order on the next candle close, placing your protective stop-loss just underneath the nearest local swing low.
- The Momentum Breakout Ride: Watch for the CCI line to break sharply past a major psychological boundary, such as the +100 or −100 threshold. A clean breakout accompanied by expanding histogram bars confirms that institutional volume is entering the market, providing an excellent signal to scale into a momentum position.
1 Download
Last Update:
May 19, 2026 02:28 AM
Published:
Jan 19, 2026 20:05 PM
Category: