Mastering Trend Geometry with Linear Regression Channels
In highly liquid financial markets, identifying the core direction of a trend while filtering out short-term market noise is a primary challenge for retail day traders. On a 15-minute (M15) chart, currency pairs like the EUR/USD frequently oscillate between rapid expansion vectors and complex consolidation ranges. Without an objective mathematical framework to anchor Price Action, traders often fall into the trap of buying at local resistance ceilings or shorting at structural demand floors.
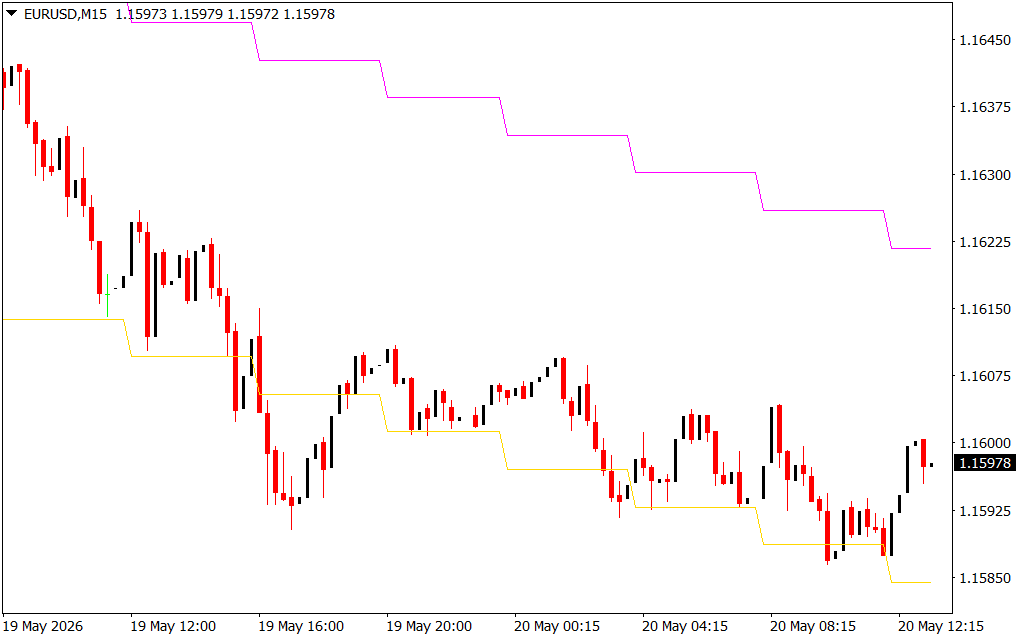
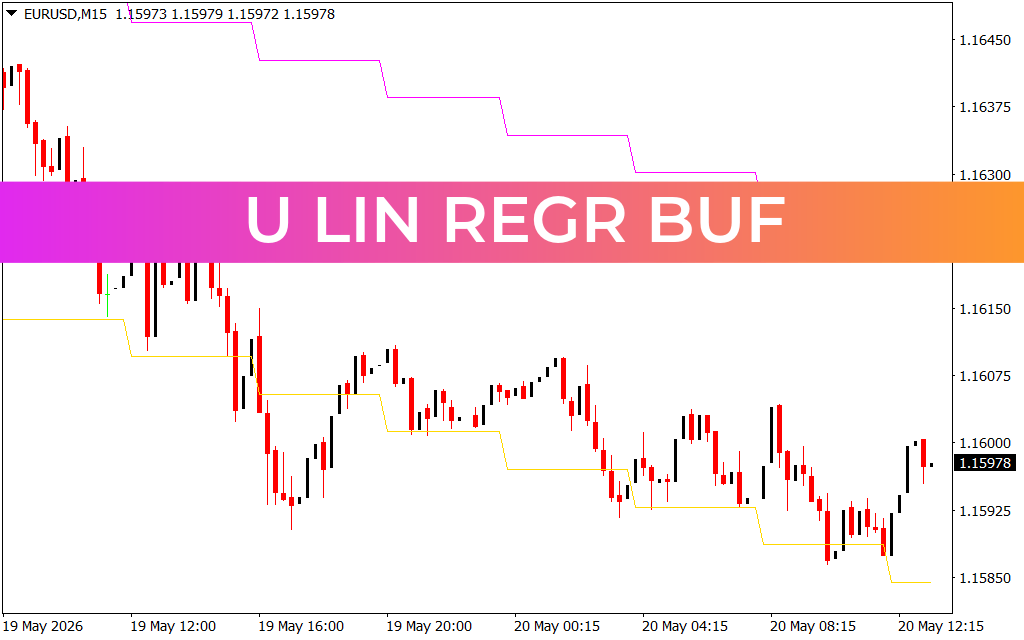
Looking closely at the EUR/USD M15 chart between May 19th and May 20th, the asset experienced an aggressive institutional markdown phase, sliding cleanly from local peaks down to a structural low near 1.15850. Following this liquidity sweep, institutional buying volume stabilized the price, kicking off a steady upward recovery. To trade these structural shifts with clinical precision, professional technical analysts utilize mathematical curve-fitting models rather than basic lagging indicators. This is precisely where the power of the U Lin Regr Buf indicator transforms your strategy.
The Power of Mathematical Equilibrium Corridors
The U Lin Regr Buf indicator applies a linear regression algorithm to raw price data over a specified lookback period. Unlike a traditional moving average, which simply averages past values and introduces severe curve lag, linear regression plots a statistically optimized straight line through a series of data points by minimizing the distance between price and the line. This center line represents the true mathematical equilibrium or fair value of the asset.
When mapped directly onto your platform workspace, this script projects a comprehensive, three-line volatility channel:
- The Fair Value Mean (Central Corridor): The middle line defines the dominant trend vector. When the EUR/USD trades consistently above an ascending median line, it confirms a healthy institutional markup phase, instructing day traders to favor long configurations.
- The Overbought Standard Deviation (Upper Buffer): The outer top line acts as a dynamic supply ceiling. When price surges into this upper threshold, it flags statistically overextended market conditions, offering an ideal zone to look for candlestick exhaustion or to lock in open profits.
- The Oversold Standard Deviation (Lower Buffer): The outer bottom line serves as an automated demand floor. As seen at the absolute bottom of the May 20th session (1.15850), when price touches this lower boundary and fails to sustain a breakdown, it signals extreme seller exhaustion, triggering a high-probability V-shaped reversal setup.
Optimizing Your Intraday Execution Framework
Relying on subjective trendlines leaves too much room for human error and emotional bias. Incorporating an automated, mathematically driven channel overlay standardizes your entry, exit, and risk-containment rules. The U Lin Regr Buf indicator operates via highly efficient data buffers, allowing it to integrate smoothly into custom expert advisors (EAs) for algorithmic execution or to stream instant alerts directly to your desktop. By integrating this professional tool into your MetaTrader infrastructure, you can confidently filter minor chart noise, optimize your risk-to-reward ratios, and execute positions in perfect harmony with true market momentum.
1 Download
Last Update:
May 20, 2026 16:16 PM
Published:
Jan 18, 2026 17:43 PM
Category: