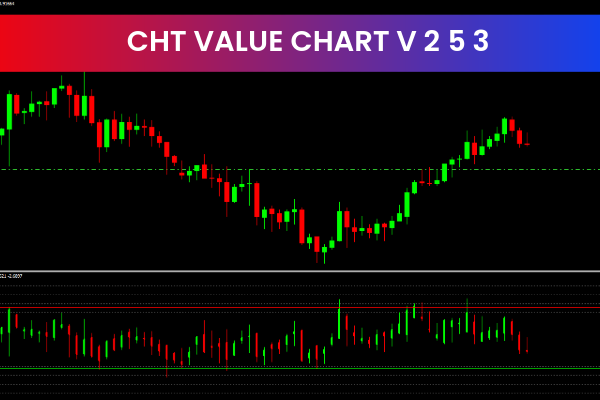
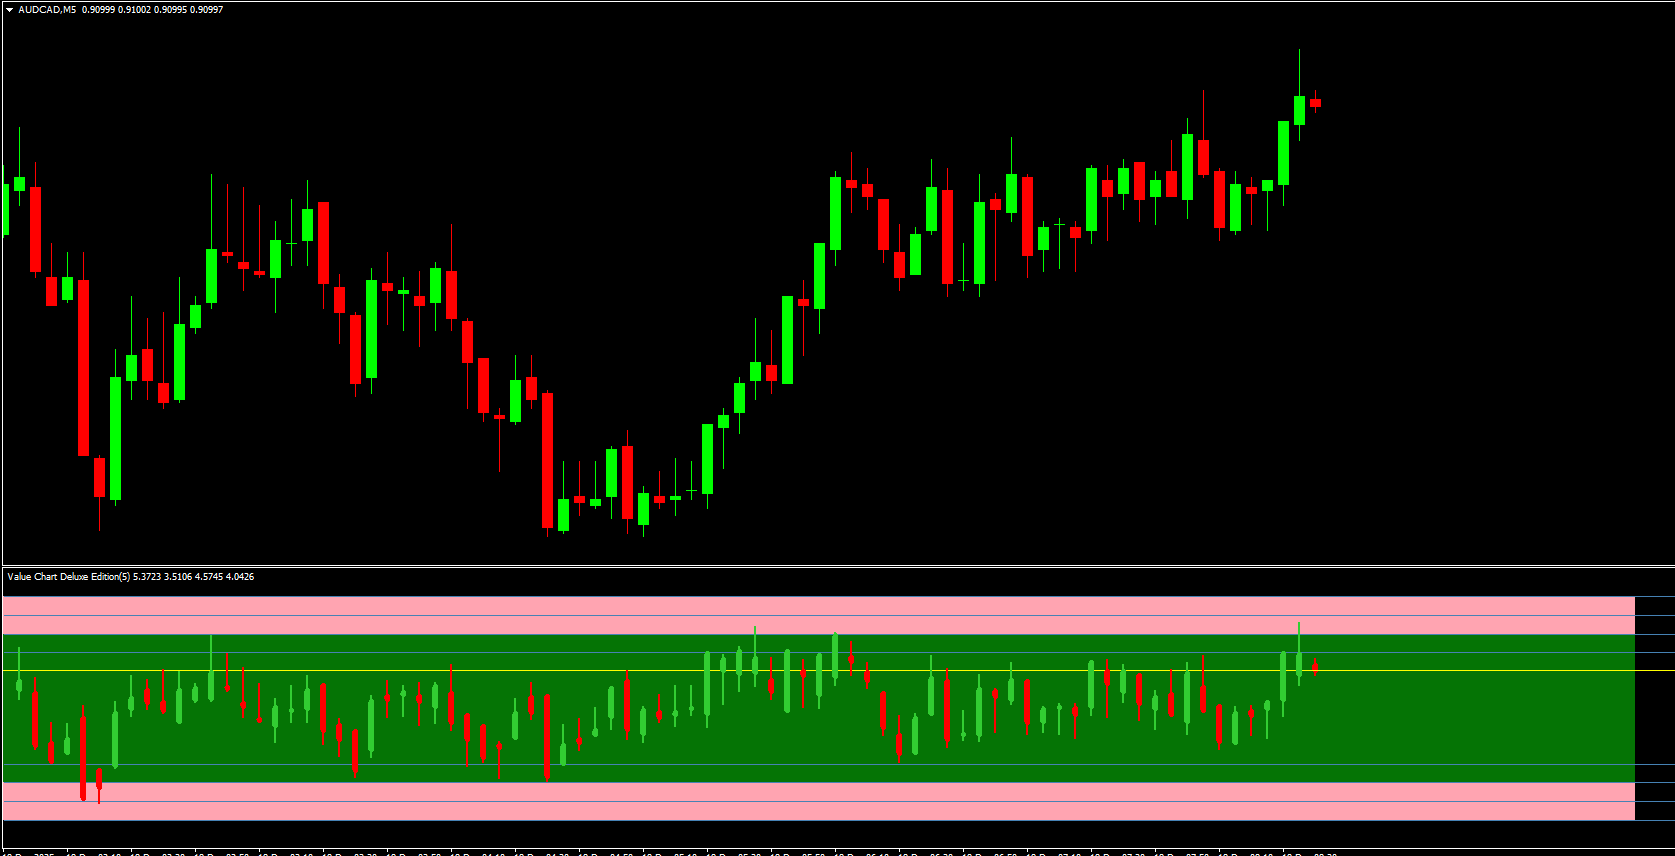
The Value Chart Deluxe Indicator is a free and powerful Forex Indicator designed for the MT4 trading platform. It helps traders identify trends, market strength, and potential trading opportunities by providing a clear visual representation of price movements. Using a unique algorithm, the indicator plots the current price level as a point on the chart and calculates the average of the last ten price points as a line, allowing traders to quickly assess trend direction and momentum.
This intuitive indicator is ideal for Scalping, day trading, and swing trading, providing both new and experienced traders with actionable insights into market behavior.
How the Value Chart Deluxe Indicator Works
The Value Chart Deluxe Indicator displays two primary elements:
Current Price Point: The real-time price of a currency pair plotted on the chart
Average Line: Calculated using the last ten price points to show the market trend
When the current price is above the average line, it signals a potential uptrend, whereas a price below the average indicates a potential downtrend. The distance between the current price and the average line reflects the trend’s strength—the larger the distance, the stronger the market momentum.
Key Features of the Value Chart Deluxe Indicator
Trend Identification: Quickly shows whether the market is bullish or bearish
Visual Representation: Clear, intuitive chart plotting makes trend analysis easier
Momentum Assessment: Distance between price and average line indicates Trend Strength
Multiple Timeframes: Effective on any MT4 timeframe
Versatility: Works with all currency pairs, supporting diverse trading strategies
Simple Setup: Easy to install and interpret, suitable for beginners and experts
Benefits of Using the Value Chart Deluxe Indicator
The Value Chart Deluxe Indicator offers several advantages for Forex traders:
Enhances Technical Analysis: Provides a visual guide for market trends
Identifies Entry and Exit Points: Traders can spot favorable trades when price crosses the average line
Assesses Trend Strength: Helps determine whether to hold or close positions based on market momentum
Supports Multiple Strategies: Effective for scalping, day trading, or swing trading
Improves Trading Confidence: Reduces guesswork by visually representing market conditions
How to Use the Value Chart Deluxe Indicator Effectively
Enter Buy Trades: When the current price crosses above the average line, indicating an uptrend
Enter Sell Trades: When the current price crosses below the average line, signaling a downtrend
Monitor Trend Strength: Larger gaps between price and average line suggest strong trends, while smaller gaps indicate weaker trends
Combine with Other Indicators: Enhance accuracy by using RSI, MACD, or moving averages alongside the Value Chart Deluxe Indicator
By incorporating the Value Chart Deluxe Indicator into your MT4 trading setup, you can improve your ability to identify trends, gauge market momentum, and make informed trading decisions, enhancing your overall trading performance.
FAQ
Value Chart Deluxe plots the current price as a point and an average of recent prices as a line, letting you see at a glance whether price is trading above or below its short‑term mean. The distance between them reflects trend strength and momentum.
When the current price crosses above the average line, it often indicates that an uptrend or bullish swing is developing; a cross below points to potential bearish movement. These events can be used as basic entry or exit triggers when confirmed by other analysis.
The indicator works on any MT4 timeframe, allowing it to support scalping, day trading and swing trading. Higher timeframes tend to filter out noise, while lower ones respond faster to short‑term shifts.
It is best used as a visual aid alongside tools such as moving averages, oscillators or support and resistance. Combining multiple perspectives usually leads to more robust decisions than relying on one plot alone.
Yes, because its point‑and‑line display is intuitive and quickly shows whether price is strong or weak relative to its recent history. Beginners should still learn basic trend and risk‑management concepts to use it effectively.
Published:
Dec 18, 2025 02:43 AM
Category: