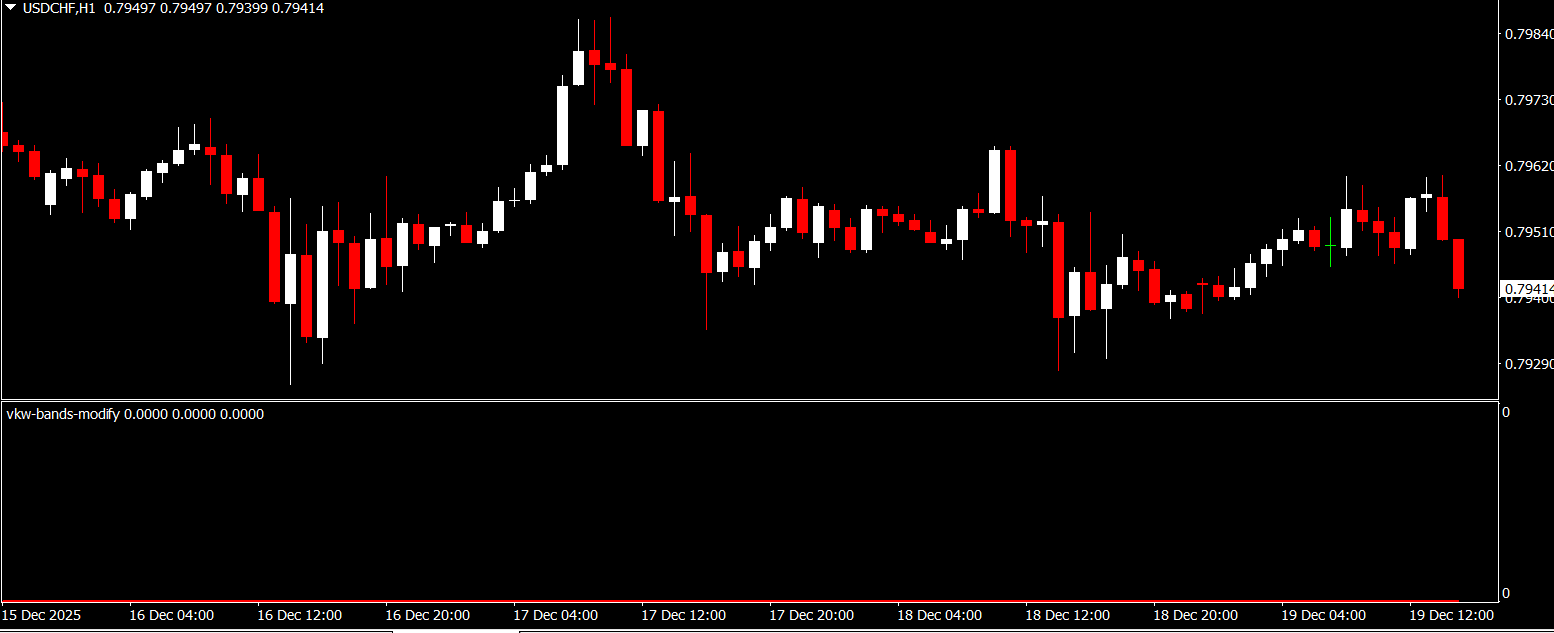
The VKW Bands Modify Indicator is a popular and free Forex Indicator designed for the MetaTrader 4 (MT4) platform. It helps traders identify potential Support And Resistance levels by analyzing market volatility. By using volatility-based bands, the indicator highlights areas where price may reverse or continue its trend, making it easier for traders to find potential entry and exit points.
This indicator is suitable for traders of all levels and can be customized to fit individual trading strategies.
What Is the VKW Bands Modify Indicator?
The VKW Bands Modify Indicator is a technical analysis tool that plots two bands on the chart based on the standard deviation of Price Action. These bands adjust according to current market volatility:
Upper Band: Represents resistance and potential overbought areas
Lower Band: Represents support and potential oversold areas
Traders use these bands to spot trading opportunities and gauge market conditions.
How the VKW Bands Modify Indicator Works
The indicator calculates the bands using standard deviation and market volatility. When price interacts with the bands:
Price above Upper Band: Market may be overbought, potential sell signal
Price below Lower Band: Market may be oversold, potential buy signal
By observing how price behaves near the bands, traders can anticipate reversals or trend continuations. The bands can also be adjusted to match the trader’s preferred sensitivity level, making the indicator flexible for different trading styles.
Key Features of VKW Bands Modify Indicator
The VKW Bands Modify Indicator offers several features that make it effective for Forex trading:
Free Forex indicator for MT4
Plots support and resistance bands based on market volatility
Identifies overbought and oversold conditions
Helps determine potential entry and exit points
Adjustable settings for customized trading
Works on all currency pairs and timeframes
Easy to install and use for beginners and advanced traders
These features make it suitable for trend trading, breakout strategies, and volatility-based trading.
How to Install and Use VKW Bands Modify Indicator on MT4
Installing the VKW Bands Modify Indicator is simple:
Add the indicator to your MT4 platform
Open a currency pair chart
Choose your preferred timeframe
Apply the indicator to the chart
Adjust the bands if necessary to match your trading style
Once applied, the indicator automatically plots upper and lower bands and updates in real time based on price volatility.
Trading Strategies Using VKW Bands Modify Indicator
Traders can use the VKW Bands Modify Indicator in several strategies:
Overbought/Sell Signal: Enter sell trades when price crosses above the upper band
Oversold/Buy Signal: Enter buy trades when price crosses below the lower band
Trend Confirmation: Use price behavior near bands to confirm Trend Continuation or reversal
Combining the indicator with other technical analysis tools, such as moving averages or oscillators, can improve the accuracy of trade signals.
Advantages and Limitations
The main advantage of the VKW Bands Modify Indicator is its ability to visualize market volatility and highlight critical support and resistance areas. It simplifies trade decision-making and enhances entry and exit timing.
However, during sideways or low-volatility markets, signals may be less reliable. Traders should use proper risk management and confirm signals with additional analysis.
Why Use VKW Bands Modify Indicator from IndicatorForest.com
At IndicatorForest.com, traders can access reliable and high-quality MT4 indicators. The VKW Bands Modify Indicator is an essential tool for spotting volatility-based support and resistance levels, helping traders make informed Forex trading decisions.
👉 Visit IndicatorForest.com to explore more free and premium MT4 indicators designed to enhance your trading strategy.

FAQ
Published:
Dec 19, 2025 09:38 AM
Category: