Unlock Market Conviction with the Volumes Trading Indicator
In the world of technical analysis, Price Action tells you what the market is doing, but volume tells you why. Volume is the ultimate validator of price movement; it represents the actual "fuel" behind every trend, breakout, and reversal. The Volumes Trading Indicator is a foundational tool for MetaTrader users, designed to provide high-visibility insight into market participation, allowing you to trade with the strength of institutional conviction rather than getting caught in retail traps.
The Power of Volume Analysis
The core principle of volume trading is simple: significant price moves must be supported by significant volume to be considered valid. If price breaks out of a resistance level on low volume, it is likely a "fakeout" caused by lack of interest. However, if that same breakout occurs with a massive spike in the Volumes Trading Indicator, it signals that major players are entering the market, drastically increasing the probability of a sustained move.
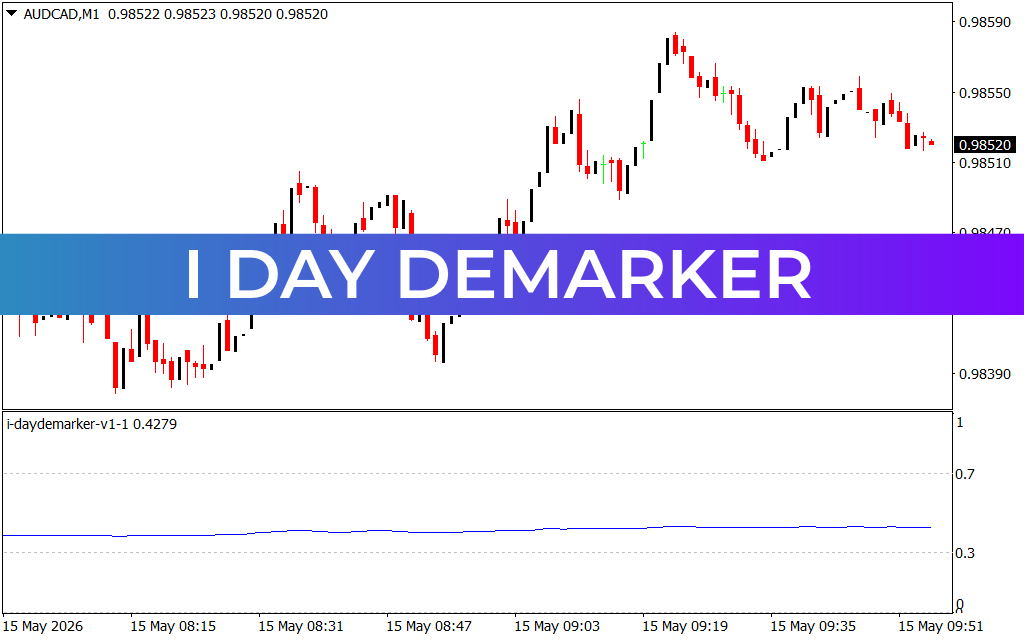
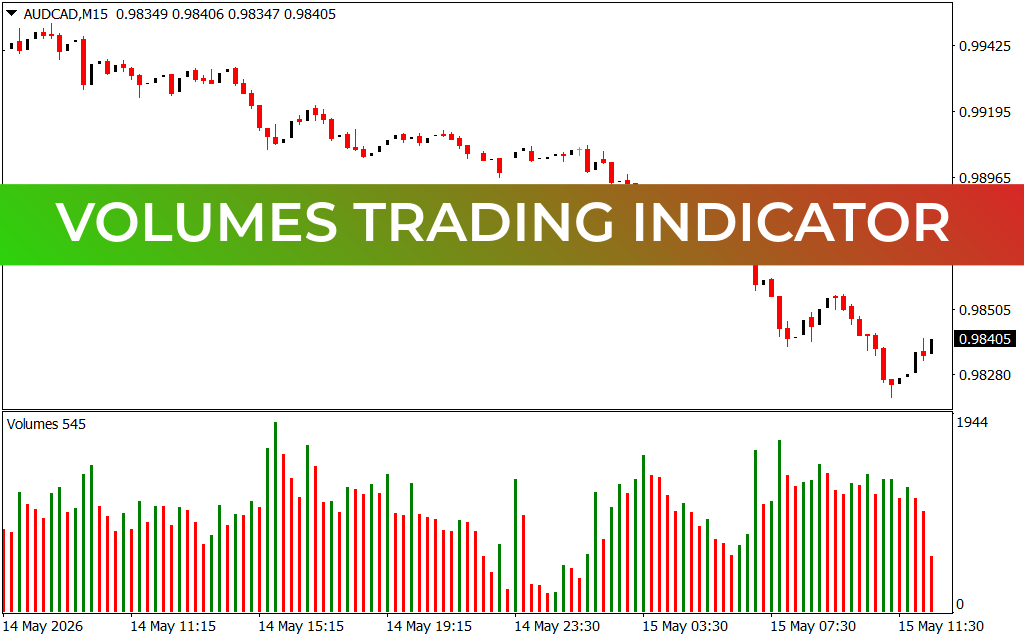
As seen in the AUD/CAD M15 chart, the indicator appears as a color-coded histogram at the bottom of the screen.
- Green Bars: Indicate that the current candle's volume is higher than the previous period's volume, suggesting increasing interest and momentum.
- Red Bars: Indicate that the volume is lower than the previous period, often signaling a cooling-off period or a lack of conviction in the current price direction.
Spotting High-Probability Breakouts
One of the most effective ways to use the Volumes Trading Indicator is through Volume-Price Confirmation. During a downtrend, as shown in the AUD/CAD example, you can observe volume spikes coinciding with the steepest parts of the descent. These spikes confirm that the selling pressure is aggressive and widespread.
For day traders and scalpers, these histogram peaks are early warning systems. A sudden, massive green bar during a period of consolidation is often the first "clue" that a breakout is imminent—frequently appearing just before the price itself begins to move.
Strategic Integration: VSA and Trend Strength
The Volumes Trading Indicator is the gateway to Volume Spread Analysis (VSA). By comparing the size (spread) of a price candle to the size of the corresponding volume bar, you can uncover hidden market dynamics:
- Strength Confirmation: Large candles accompanied by high volume bars confirm a healthy trend.
- Effort vs. Result: If you see a very small price candle with a massive volume bar, it indicates "churning"—a massive battle between buyers and sellers where the trend may be about to stall or reverse.
- Climatic Volume: A giant volume spike after a long trend often signals a "buying or selling climax," marking the absolute end of a move and a prime opportunity for reversal traders.
Why Every Professional Workspace Needs Volume
While many indicators rely on lagging price averages, volume is a leading indicator of market intent. The Volumes Trading Indicator strips away the guesswork, showing you exactly where the "smart money" is putting its capital. It is an essential filter for any strategy, whether you are trading breakouts, pullbacks, or reversals. By integrating volume into your MetaTrader setup, you stop following the crowd and start following the conviction of the market's biggest participants.
1 Download
Last Update:
May 15, 2026 15:40 PM
Published:
Jan 21, 2026 20:37 PM
Category: