Precision Market Timing with the I Day DeMarker Indicator
In the volatile world of day trading, the ability to identify price exhaustion and impending reversals is the difference between catching a massive move and getting stopped out. The I Day DeMarker indicator is a sophisticated technical tool designed to measure demand for an asset by comparing its most recent maximum and minimum prices to the previous period's Price Action. Unlike traditional oscillators that often get "stuck" in overbought or oversold territory during strong trends, the DeMarker provides a more nuanced view of market sentiment and intra-day fluctuations.
The Science Behind the DeMarker Oscillator
Developed by legendary technical analyst Tom DeMark, the DeMarker (DeM) indicator focuses on the "inter-period" price action. It calculates the "DeMax" (the difference between the current high and the previous high, if positive) and the "DeMin" (the difference between the current low and the previous low, if negative).
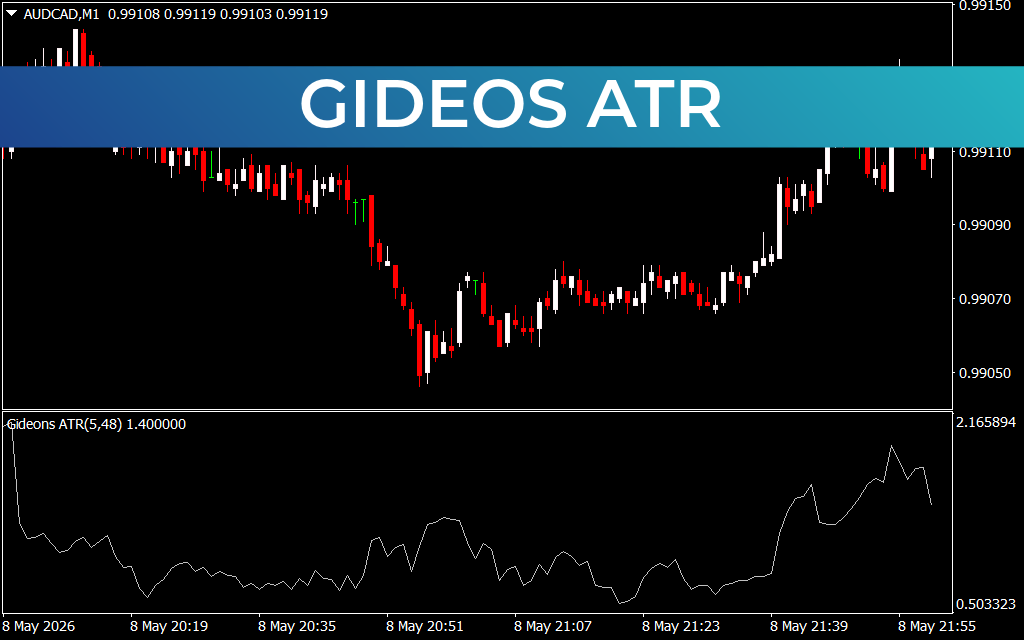
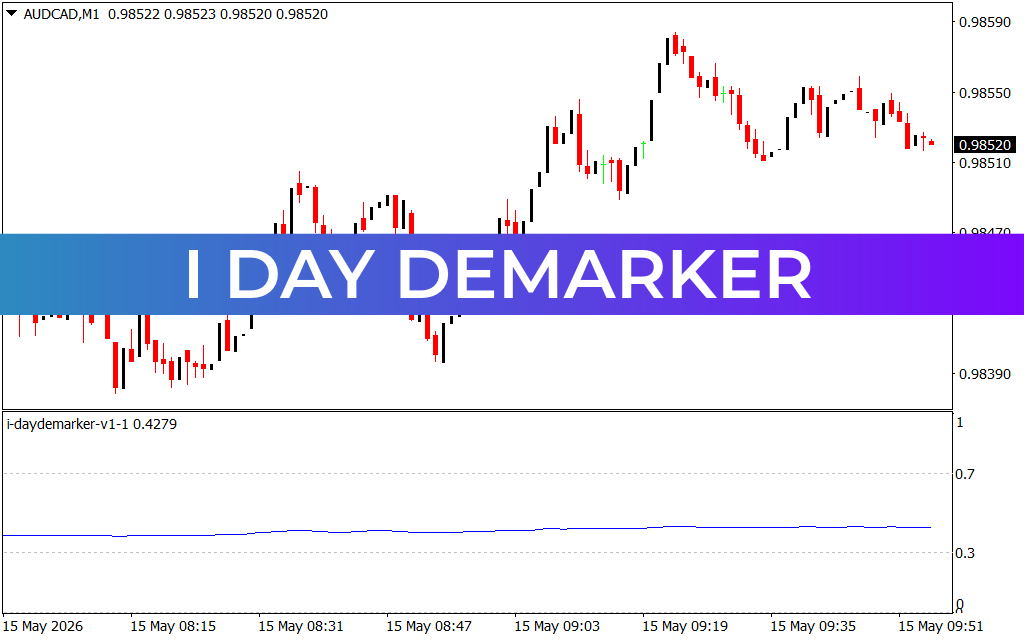
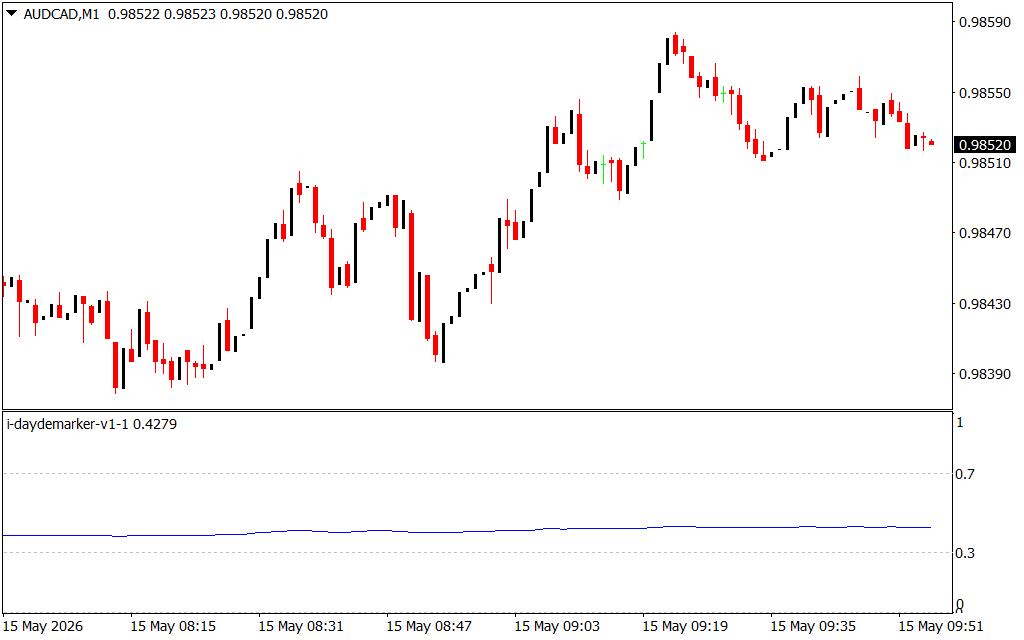
The I Day DeMarker version specifically optimizes these calculations for intra-day timeframes, such as the 1-minute (M1) chart shown in the AUD/CAD preview. By smoothing out erratic price spikes, it provides a clearer picture of when a market has truly reached its limit.
Key Trading Levels and Interpretation
The indicator typically fluctuates between a value of 0 and 1. Traders focus on two critical threshold levels:
- Overbought (Above 0.7): When the I Day DeMarker rises above 0.7, it suggests that buying pressure has reached a peak. While the trend may still be strong, this is a warning signal that a temporary pullback or a full reversal is likely.
- Oversold (Below 0.3): When the indicator dips below 0.3, it signals that selling pressure is exhausted. This is often the ideal zone to look for bullish entry patterns as the "smart money" begins to accumulate positions.
Strategy Integration: Scalping and Trend Following
One of the most effective ways to use the I Day DeMarker is by identifying divergences. If the price of a currency pair like AUD/CAD makes a new high, but the DeMarker fails to break its previous peak, it indicates that the momentum is weakening despite the price increase. This is a high-probability signal for a short entry.
For trend followers, the DeMarker acts as a powerful filter. Instead of chasing a move that is already overextended, traders can wait for the indicator to return to a "neutral" zone (near 0.5) before adding to a position. This ensures that you are entering trades with the best possible risk-to-reward ratio.
Why Every MetaTrader User Needs This Tool
The I Day DeMarker is an essential component for any trader focused on precision. It doesn't just tell you where the price is; it tells you how much "energy" is left in the current move. Whether you are a high-frequency scalper or a conservative day trader, adding this indicator to your MetaTrader setup provides the objective data needed to make disciplined trading decisions and avoid emotional entries.
1 Download
Last Update:
May 15, 2026 12:56 PM
Published:
Jan 21, 2026 22:32 PM
Category: