Unlock the Secrets of Market Sentiment with VSA Text for MT4
In the complex ecosystem of financial markets, Price Action is only half the story. To truly understand why a market moves, you must look at the volume behind the candles. Volume Spread Analysis (VSA) is the professional methodology of choice for identifying where "Smart Money" is active. The VSA Text indicator for MetaTrader 4 (MT4) simplifies this complex analysis by labeling market behavior directly on your chart, allowing you to trade with institutional-grade clarity.
What is VSA Text?
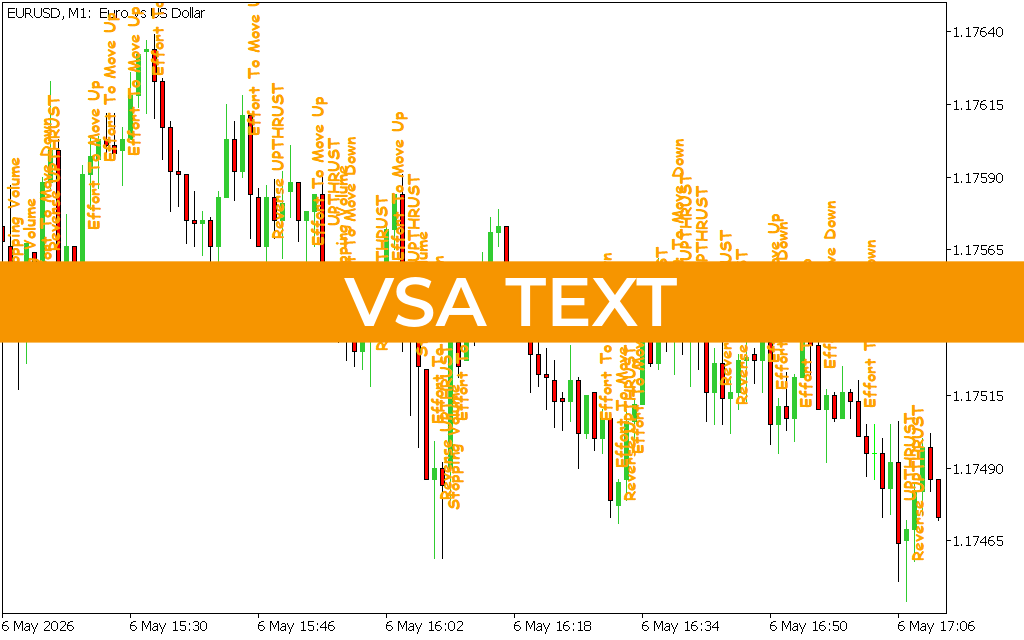
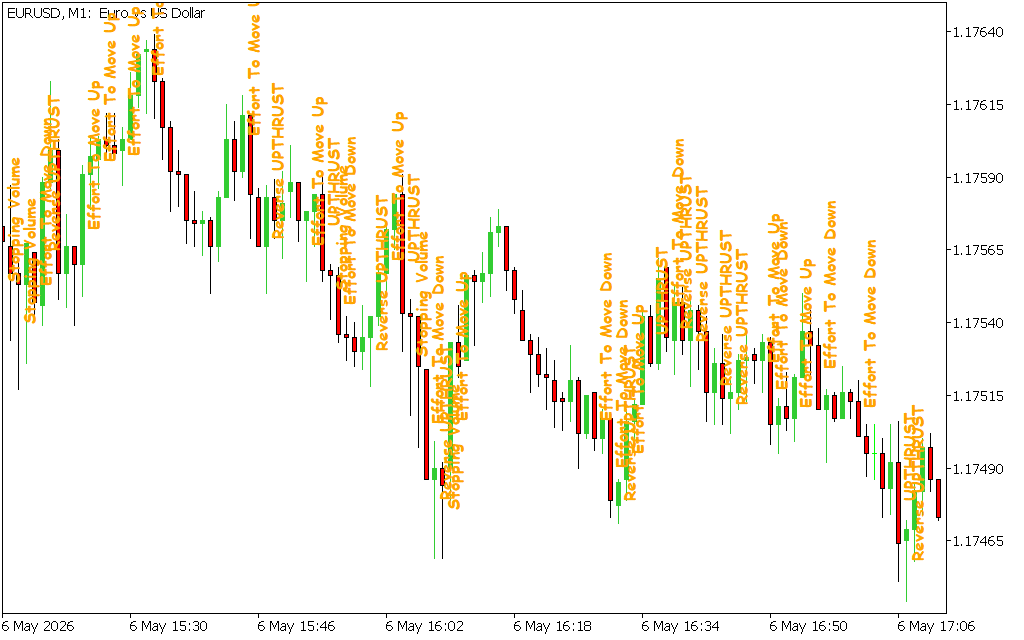
VSA Text is an advanced technical tool that analyzes the relationship between price spread, volume, and closing price. Instead of requiring you to memorize dozens of complex bar formations, this indicator processes the data in real-time and prints clear, descriptive text labels above or below individual candles.
As seen in the provided EURUSD M1 chart, the indicator identifies specific institutional behaviors such as "Effort to Move Up," "Stopping Volume," and "Reverse UPTHRUST." This visual mapping transforms a standard chart into a readable narrative of supply and demand imbalances.
Key Features and Benefits
- Institutional Logic Decoded: The indicator identifies "Smart Money" maneuvers like Upthrusts and Stopping Volume—signals that typically precede major reversals.
- Real-Time Narrative: By labeling candles as they form, VSA Text tells you if the current move is supported by professional interest or if it is a "trap" designed to lure retail traders.
- Simplified Decision Making: You no longer need to be an expert in Wyckoff theory. The indicator handles the heavy lifting, labeling "Effort to Move Down" or "Stopping Volume" so you can react instantly.
- Clean Visual Interface: Despite the depth of data, the orange text labels are positioned perfectly to keep your chart readable, ensuring you can still perform standard price action or Support And Resistance analysis.
Strategic Trading Applications
The most effective way to utilize VSA Text is through Supply and Demand Confirmation. For instance, in a bearish trend, seeing an "Effort to Move Down" label confirms that professional sellers are aggressively pushing price lower. Conversely, if price drops into a support level and the indicator prints "Stopping Volume," it signals that institutions are absorbing the selling pressure, preparing for a potential bullish reversal.
Furthermore, it is an exceptional tool for Identifying Fake-Outs. A classic "Reverse UPTHRUST" label during a breakout attempt indicates that the move lacks institutional backing and is likely to fail. By avoiding these traps, traders can significantly improve their win rate and overall account health.
Conclusion
The VSA Text indicator is an essential asset for any MT4 trader who wants to see beyond the surface of price movement. It provides the structural clarity and institutional insights needed to stop guessing and start trading with the flow of professional capital. Whether you are Scalping the 1-minute charts or swing trading the dailies, VSA Text provides the definitive edge required in today's volatile markets.
.
Last Update:
May 06, 2026 21:20 PM
Published:
Jan 26, 2026 20:46 PM
Category: