Simplify Your Strategy with the Weekly Indicator for MetaTrader
In the complex environment of day trading and Scalping, it is easy to lose sight of the "big picture." Small price fluctuations on lower timeframes can often mask the critical levels where institutional players are making their moves. The Weekly Indicator for MT4 and MT5 is a professional-grade tool designed to ground your technical analysis in higher-timeframe reality, providing essential context for every trade you take.
The Power of Weekly Market Structure
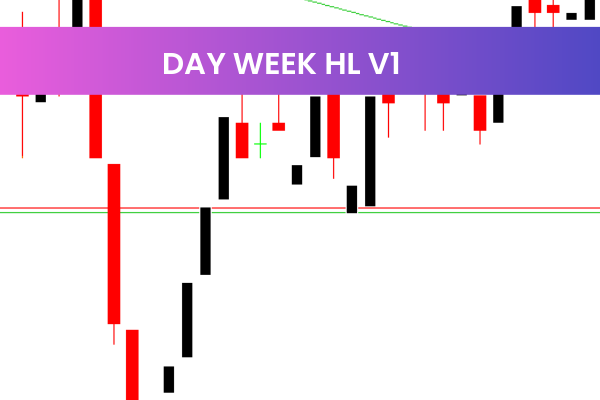
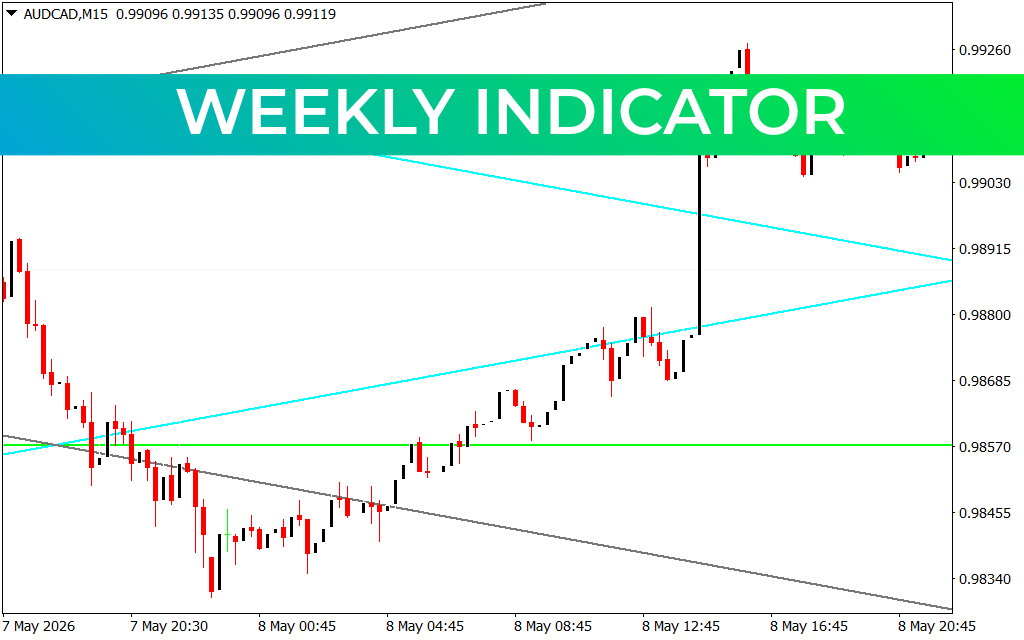
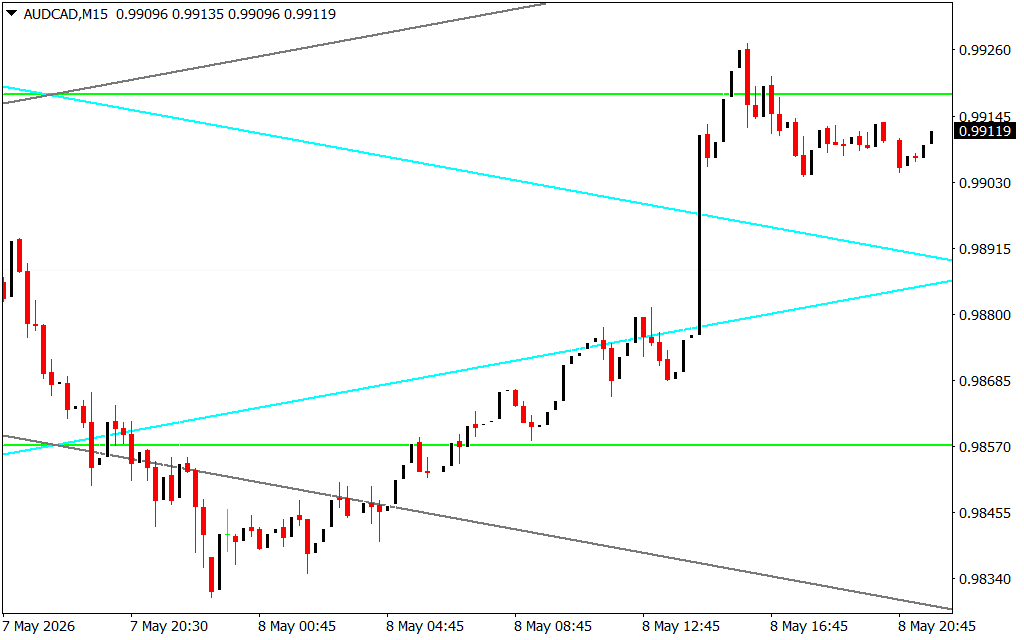
Successful trading is often about identifying where price has been and where it is likely to find friction. The Weekly Indicator automatically calculates and plots key levels derived from the weekly candle directly onto your intraday charts. As seen on the M15 timeframe, the indicator draws horizontal and diagonal projection lines—such as the green horizontal support/resistance levels and cyan trend channels—to show exactly where the weekly momentum is shifted.
By having these levels constantly visible, traders can avoid the common mistake of "trading into a brick wall." For example, if you see a bullish setup on a 5-minute chart but the Weekly Indicator shows a major weekly resistance level just a few pips away, you know the probability of a successful breakout is significantly lower.
Key Features of the Weekly Indicator
- Automated Level Generation: No more manual drawing. The indicator instantly identifies the weekly open, high, low, and close (OHLC) levels, which act as psychological magnets for Price Action.
- Multi-Timeframe Integration: Whether you are trading on the M1, M5, or M15, the weekly projections remain anchored, giving you a consistent "north star" for your bias.
- Dynamic Channel Projections: The tool uses historical weekly volatility to project potential expansion zones (the cyan and grey diagonal lines). These often mark the absolute ceiling or floor for a weekly move.
- Institutional Confluence: Big banks and hedge funds focus heavily on weekly levels for position sizing and profit-taking. By using this indicator, you are essentially looking at the market through the same lens as the "Smart Money."
Trading with the Weekly Bias
The most effective way to use the Weekly Indicator is as a directional filter. If the price is trading above the weekly open and holding above the projected weekly support, your intraday bias should remain strictly bullish. Conversely, if the price breaks below a major weekly horizontal level (green line), it signals a potential shift in trend that could last for several days.
Scalpers find this tool particularly useful for identifying "take profit" targets. Instead of guessing where a rally might end, you can target the next projected weekly boundary for a high-precision exit.
Conclusion
Precision in trading comes from understanding the hierarchy of timeframes. The Weekly Indicator eliminates the need for constant timeframe switching, allowing you to maintain a high-level perspective while executing on lower timeframes. It is a vital addition to any trading system, from simple price action to complex algorithmic strategies. Level up your chart analysis and start trading with the strength of the weekly trend behind you.
2 Downloads
Last Update:
May 09, 2026 20:49 PM
Published:
Jan 25, 2026 01:53 AM
Category: