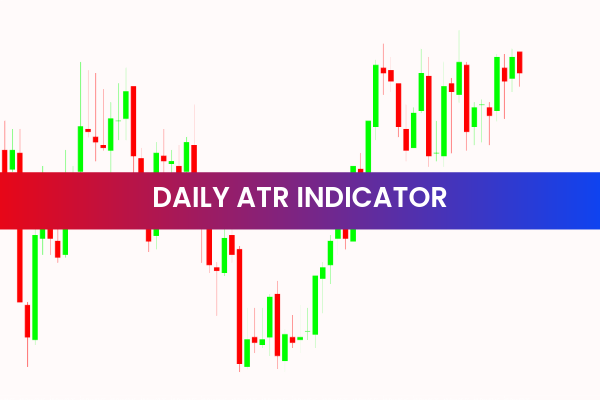
The Daily ATR Indicator is a popular and free tool for traders using the MetaTrader 4 (MT4) platform. It is designed to provide a clear and concise measurement of the average daily range (ATR) of a currency pair, helping traders make more informed buy and sell decisions. By understanding daily price movements, traders can optimize trade timing and improve overall strategy effectiveness.
How the Daily ATR Indicator Works
The Daily ATR Indicator calculates the average true range (ATR) of a currency pair over a specified period. The ATR measures volatility and provides insight into potential price movements.
The indicator considers:
Previous day’s closing price
Current day’s high and low prices
Current day’s closing price
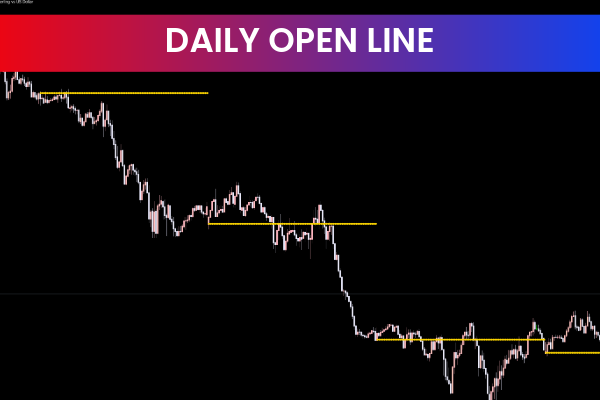
This data is plotted as a line on the chart, allowing traders to visualize the daily range of the currency pair. Additionally, the indicator creates two levels per day:
Red level: Highest daily ATR
Yellow level: Lowest daily ATR
These visual cues help traders identify potential Support And Resistance areas, giving a clear understanding of where Price Action might react.
Key Features of the Daily ATR Indicator
The Daily ATR Indicator offers several features that make it an essential tool for Forex traders:
Calculates the average daily range (ATR) for accurate volatility measurement
Plots the ATR as a line on the MT4 chart for easy visualization
Displays high (red) and low (yellow) ATR levels for the day
Works on all MT4 timeframes and currency pairs
Free and easy to install on MT4
Helps identify potential support and resistance zones
Suitable for intraday, short-term, and swing trading strategies
These features allow traders to understand market behavior, anticipate price swings, and make informed trading decisions.
Benefits of Using the Daily ATR Indicator
The Daily ATR Indicator provides several benefits for traders of all experience levels:
Helps measure market volatility and understand daily price movement potential
Assists in timing entries and exits based on the daily range
Highlights areas of high and low volatility for improved risk management
Supports intraday trading strategies by showing likely price movement limits
Enhances trade planning by providing clear support and resistance levels
By using the Daily ATR Indicator, traders can adjust their trading decisions based on market volatility, improving the risk-reward ratio and maximizing potential profits.
How Traders Can Use the Daily ATR Indicator Effectively
To use the Daily ATR Indicator effectively:
Enter long trades near the lower ATR level and target the upper ATR level
Enter short trades near the upper ATR level and target the lower ATR level
Use ATR levels in combination with other technical indicators such as moving averages or trend lines for confirmation
Monitor daily volatility to set realistic stop-loss and take-profit levels
Apply across multiple currency pairs to identify the most favorable trading opportunities
By combining ATR analysis with proper trade management, traders can capitalize on intraday market movements while minimizing exposure to unexpected price swings.
Why the Daily ATR Indicator Is Popular
The Daily ATR Indicator is widely used because it simplifies volatility analysis and provides actionable insights into daily price behavior. Its clear visual representation of ATR levels allows traders to quickly assess market conditions and make well-informed trading decisions.
Overall, the Daily ATR Indicator is a valuable MT4 tool for traders seeking to measure daily price volatility, identify key levels, and enhance their overall trading strategy.
Explore the Daily ATR Indicator today. Visit IndicatorForest.com to download this free MT4 indicator and access additional professional Forex trading tools.
FAQ
Daily ATR plots the average true range of each day so you can see how much a pair typically moves in a session. It also highlights high and low daily range levels that act as reference zones.
You can size stop‑loss and take‑profit levels in relation to the current daily ATR, for example using fractions or multiples of it. This ensures your trade expectations match the actual daily volatility.
The red level marks the higher daily range extremes while the yellow marks lower ones, giving you a visual band of typical movement. Price pushing beyond these zones can signal unusually strong moves or potential exhaustion.
It is most informative on intraday charts like M15, M30 or H1 where you plan trades within the day but want awareness of the full‑day range. It can also be used on H4 for swing setups.
No. ATR only measures volatility, not whether price will go up or down. You should pair it with trend tools or price patterns that provide directional bias.
Published:
Dec 18, 2025 01:50 AM
Category: