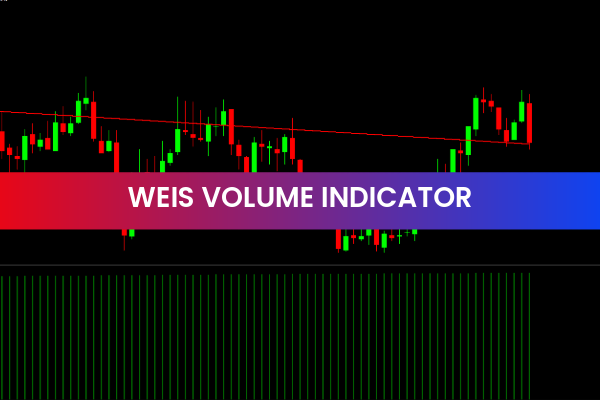
The Weis Wave Volume Indicator is a popular and free Forex Indicator for the MetaTrader 4 platform, designed by David Weis, the author of Trading with the Odds. This indicator provides traders with a visual representation of market volume in a wave-like pattern, helping them understand buying and selling pressure in the Forex market.
Unlike traditional volume indicators, the Weis Wave Volume Indicator does not rely on arrows or line crossovers to generate buy or sell signals. Instead, it emphasizes trend strength and market sentiment by showing how volume accumulates over price movements.
How the Weis Wave Volume Indicator Works
The indicator measures the volume of a currency pair during a specified period and displays it as a wave. Each wave corresponds to the cumulative volume associated with a price movement.
Bullish waves represent buying pressure and indicate the strength of demand.
Bearish waves represent selling pressure and indicate the momentum strength of supply.
Traders can use this information to analyze trends and identify potential trading opportunities. A large volume spike in a wave often signals a strong trend, whereas low-volume waves may suggest market consolidation or preparation for a breakout.
Key Features of the Weis Wave Volume Indicator
The Weis Wave Volume Indicator includes several features that make it a powerful tool for Forex trading:
Visualizes cumulative volume in wave-like patterns
Differentiates between bullish and bearish volume
Helps identify Trend Strength and momentum
Highlights potential breakout or consolidation areas
Works on all MT4 timeframes and currency pairs
Free and easy to install on MT4
Ideal for both short-term and long-term trading strategies
These features allow traders to gain insight into market behavior without relying solely on Price Action or simple indicators.
Benefits of Using the Weis Wave Volume Indicator
The main benefit of the Weis Wave Volume Indicator is its ability to provide objective volume analysis. By comparing the volume of each wave to the corresponding price movement, traders can determine the strength of the trend and make more informed decisions.
Key advantages include:
Understanding buyer and seller strength in real-time
Detecting potential trend reversals before price reacts
Identifying consolidation zones where breakout opportunities may arise
Supporting trade timing by analyzing wave duration, price change, and cumulative volume
The indicator is especially useful for traders who want to analyze market participation, confirm trends, and avoid entering trades during weak or low-volume moves.
How Traders Can Use the Indicator Effectively
To use the Weis Wave Volume Indicator effectively, traders should evaluate:
Wave duration: How long the current trend has lasted
Price movement: How much the price has changed during the wave
Cumulative volume: The total volume represented by the wave
By combining these factors, traders can assess whether a trend is strong enough to enter or if the market is likely to consolidate. Additionally, the indicator can be used alongside support and resistance levels, moving averages, or other trend indicators to increase the probability of successful trades.
Why the Weis Wave Volume Indicator Is Popular
The Weis Wave Volume Indicator remains popular because it provides deep insight into market volume and trend dynamics without cluttering the chart with signals or arrows. Its wave-based representation allows traders to quickly see where buyers or sellers are dominant and anticipate potential market moves.
Overall, the Weis Wave Volume Indicator is a reliable MT4 tool for traders seeking to analyze volume, measure trend strength, and identify high-probability trading opportunities.
Enhance your trading strategy with the Weis Wave Volume Indicator. Visit IndicatorForest.com to download this free MT4 indicator and explore more professional Forex tools.
FAQ
Weis Wave Volume groups tick volume into waves aligned with price swings, showing how much buying or selling volume is behind each move. This visualizes whether demand or supply is driving the market.
Bullish waves with strong volume suggest committed buying, while bearish waves with strong volume indicate aggressive selling. Weak volume in either direction often signals consolidation or lack of conviction.
You can favor trades in the direction of waves with rising volume and be cautious when a strong price move occurs on falling volume. Large climax waves may also warn that a trend is nearing exhaustion.
Yes. The structure of waves will change with timeframe, but the idea of seeing volume behind each swing applies from short intraday charts to longer‑term swings.
Price‑action tools, support/resistance and trend indicators help you interpret whether a strong volume wave is breaking through a key area or just reacting within a range.
4 Downloads
Published:
Dec 18, 2025 00:52 AM
Category: