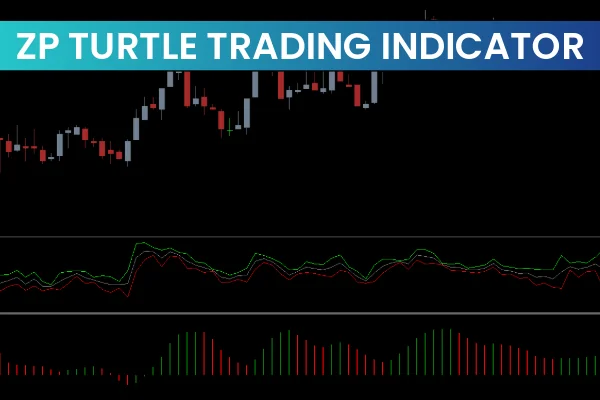
The ZP Turtle Trading Indicator for MT4 is a powerful breakout-based Forex Indicator inspired by the legendary Turtle Trading System created by Richard Dennis and William Eckhardt. Designed to detect breakout levels with high accuracy, this indicator helps traders follow a rule-based approach to identify trend direction, buy/sell opportunities, and price momentum. If you trade forex using breakout strategies, the ZP Turtle Trading Indicator can help you make clearer and more confident decisions.
The main trading concept behind this indicator is straightforward — buy when price breaks resistance and sell when it breaks support. With simple visual signals and breakout lines, the ZP Turtle Trading Indicator makes it easy for both beginners and professional traders to follow systematic breakout rules.
How the ZP Turtle Trading Indicator Works
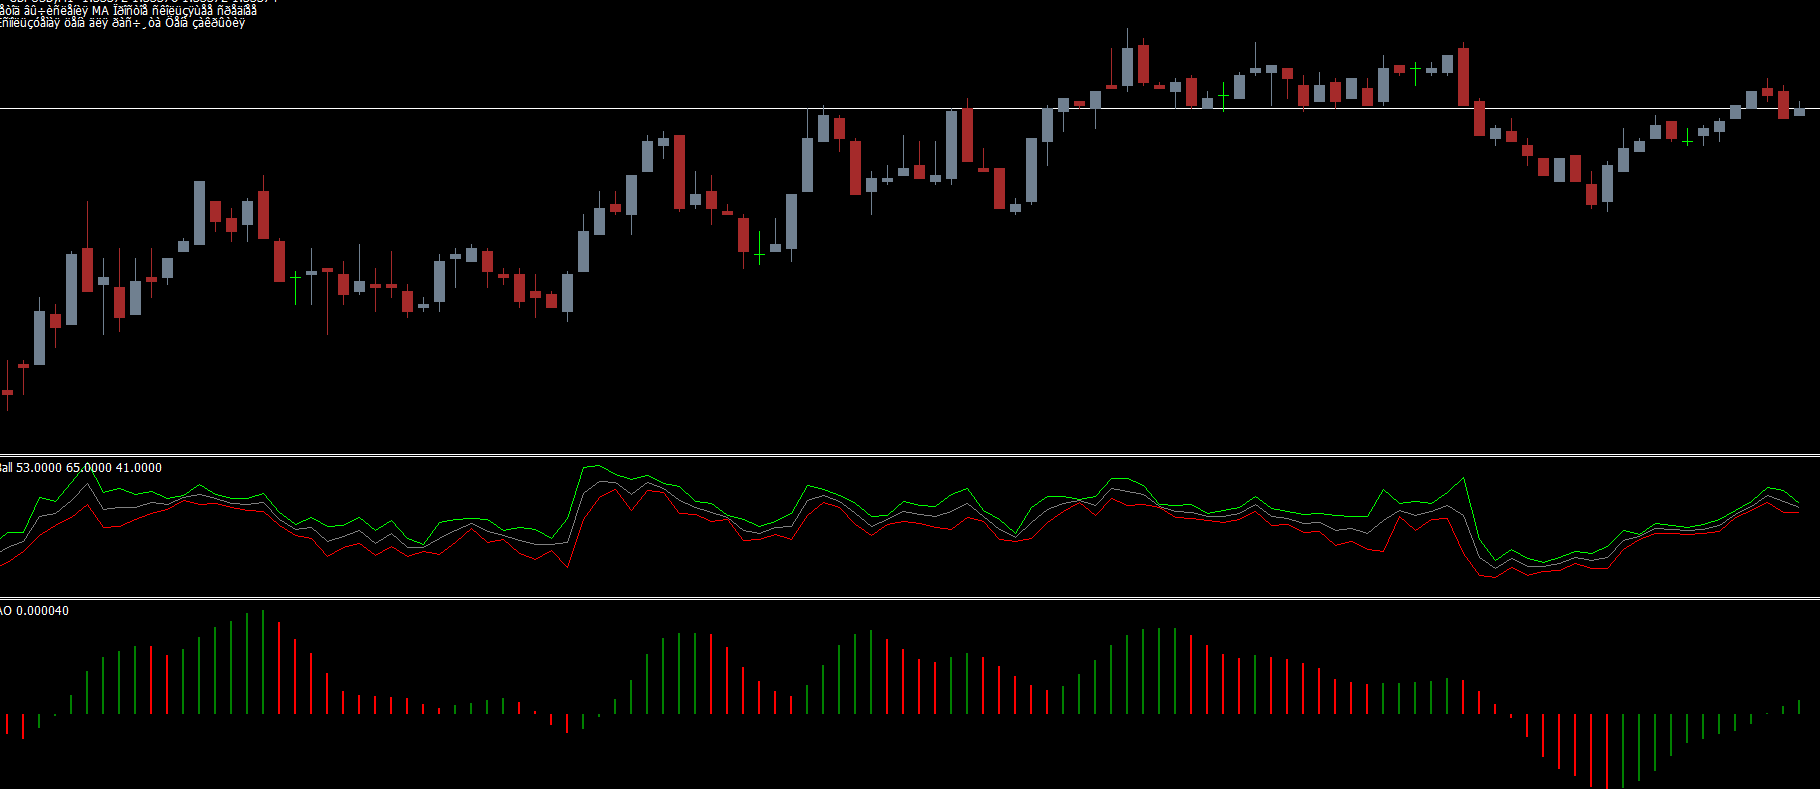
The ZP Turtle Trading Indicator automatically scans the chart and draws breakout zones based on recent price highs and lows. These levels act as powerful support and resistance zones. The indicator then plots arrows to confirm a potential trade direction.
Blue breakout level: Indicates potential bullish breakout
Red breakout level: Indicates potential bearish breakout
Blue arrow: Signals a possible long entry
Red arrow: Signals a possible sell setup
This method allows traders to visually identify breakout opportunities without heavy chart analysis. The indicator works on all MT4 supported currency pairs and trading instruments, including forex, commodities, metals, and indices.
Best Timeframes to Use
Although the ZP Turtle Trading Indicator works on all timeframes, it performs best on higher timeframes such as:
H1
H4
D1
Higher timeframes help filter minor noise and avoid false breakouts, providing more reliable trade setups.
ZP Turtle Trading Indicator Buy & Sell Strategy
To take a buy trade, follow these conditions:
The indicator draws a blue breakout line
A blue arrow appears above recent Price Action
Price closes above the breakout level
Stop-loss can be placed below the previous breakout low.
For a sell trade, conditions include:
A red breakout line
A red arrow appears below price
Price closes below the breakout level
Stop-loss can be set above the recent swing high.
Traders can take partial profit on opposite signals or use trailing stops for extended trends.
Why Use the ZP Turtle Trading Indicator?
Here are key benefits of this breakout tool:
Simple and rule-based structure
Clear breakout levels
Perfect for trend-following traders
Ideal for swing trading and intraday trading
Works with any trading strategy
When combined with additional confirmation tools such as Moving Averages, RSI, ATR, or MACD, traders can further improve accuracy and trade confidence.
Trading Tips for Best Results
Avoid trading during low-volume sessions.
Confirm entries using Market Structure and candlestick patterns.
Use risk management and favorable risk-to-reward ratios.
Test the indicator on a demo account before live trading.
To improve your understanding of breakout trading, you can also review material from Investopedia and BabyPips Academy, known for reliable trading education.
Conclusion
The ZP Turtle Trading Indicator for MT4 is a reliable and user-friendly breakout tool for forex traders. By combining breakout lines and arrow-based signals, it provides a clean and effective way to identify long and short trading opportunities. Whether you’re a beginner or an experienced trader, this indicator can help improve timing, trend direction analysis, and overall profitability.
👉 Download the ZP Turtle Trading Indicator today from IndicatorForest.com and upgrade your Breakout Trading Strategy.
FAQ
3 Downloads
Published:
Dec 07, 2025 21:50 PM
Category: