Mastering Structural Market Swings: Precision Trend Mapping with ZZ Orlova V1
In the fast-moving foreign exchange and CFD markets, isolating the true structure of price delivery is the foundation of any successful trading edge. On lower timeframes like the 1-minute (M1) chart, high-frequency day traders and scalpers are continuously forced to process immense amounts of market noise. Minor fluctuations, temporary pullbacks, and erratic price spikes frequently trick retail traders into misidentifying key swing highs and swing lows. Without an objective system to map pure price geometry, traders fall victim to emotional hesitation—either entering a position too late or misplacing their stop losses outside of actual structural boundaries.
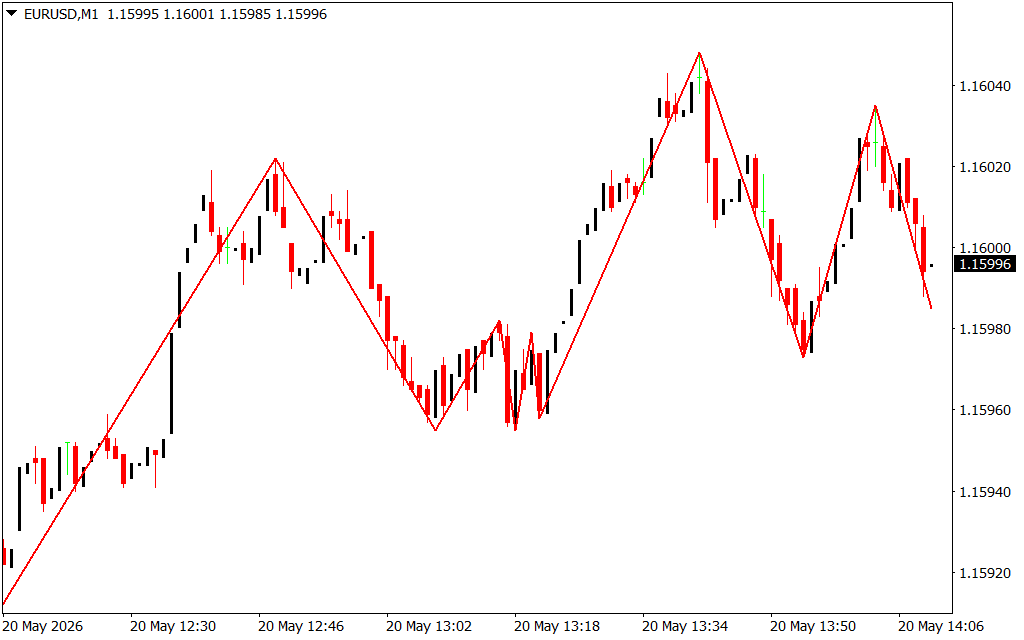
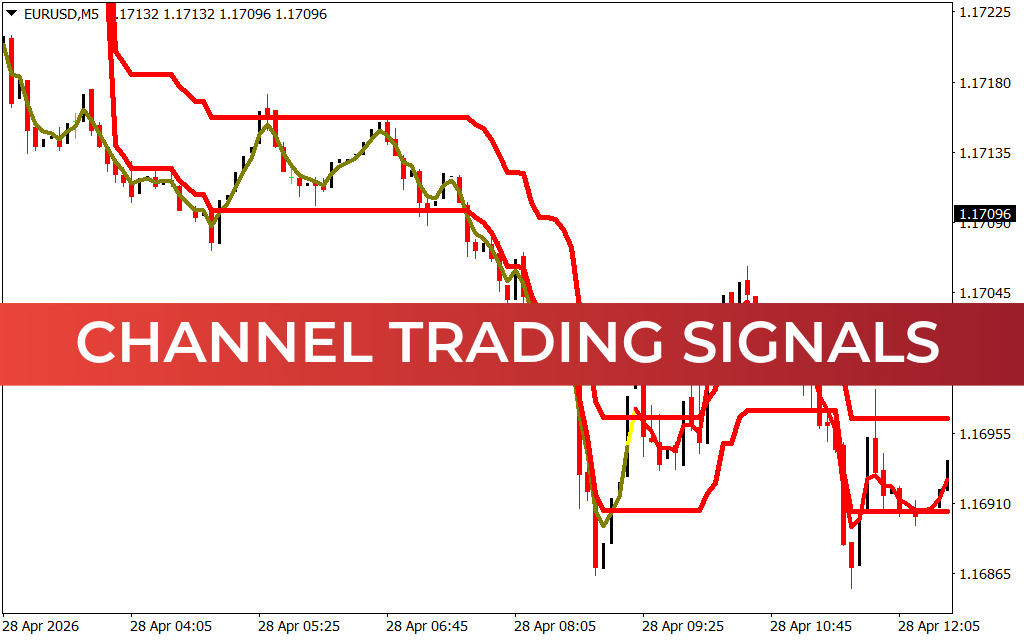
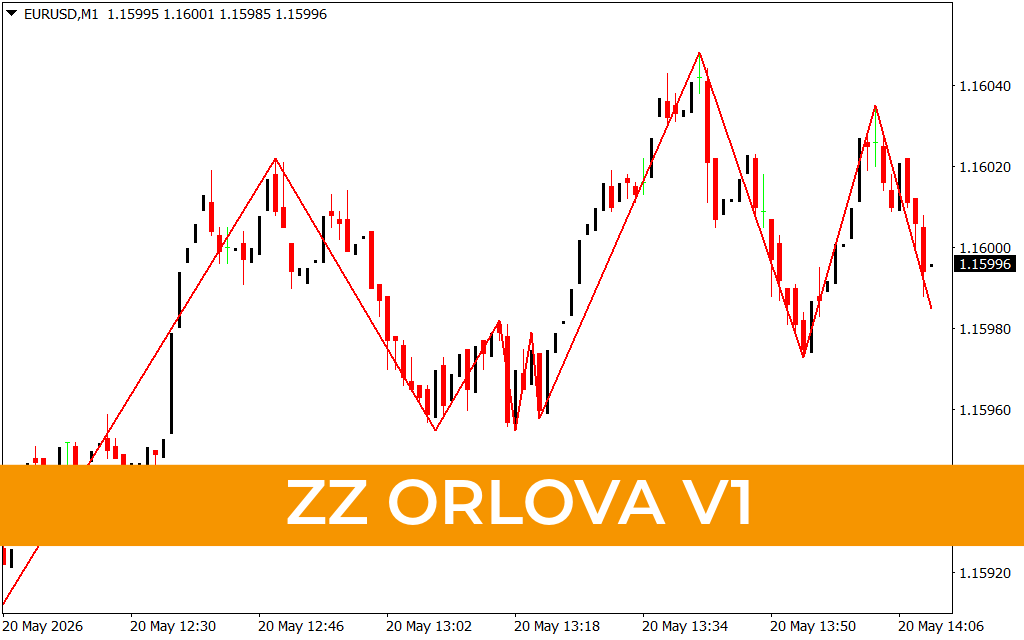
A close technical look at the EUR/USD M1 price delivery reveals a beautifully clean sequence of market expansions. The asset initially establishes a strong, multi-candle upward drive, steadily climbing from baseline values to print an intermediate peak near 1.16030. Following a brief corrective retracement that shakes out impatient longs, a powerful surge of institutional volume pushes the pair back up to form a higher structural ceiling near the 1.16045 handle. To track these shifting technical peaks and troughs without second-guessing your analysis, you need an automated structural filter: the ZZ Orlova V1 indicator.
The Power of Algorithmic ZigZag Smoothing
The ZZ Orlova V1 represents an advanced, highly optimized reengineering of the classic ZigZag technical formula. Instead of relying on rigid, lagging calculations that distort during fast-paced market regimes, this custom utility applies a dynamic mathematical filter to filter out random intraday noise. By drawing clean, continuous red structural lines directly across major price pivots, the indicator provides clear operational advantages:
- Instant Structural Clues: The script visually links major swing highs and swing lows across your workspace canvas. This continuous line pattern gives day traders an instant, objective view of the active trend structure—making it incredibly simple to identify classic higher-high or lower-low expansion sequences.
- Flawless Harmonic and Wave Tracking: For traders deploying Elliott Wave strategies or trading harmonic chart geometries, this indicator removes all subjectivity. The red line matrix tracks the absolute extremities of price delivery, ensuring your structural counts and measurements are perfectly accurate.
- Dynamic Support And Resistance Baselines: Every sharp peak and trough locked in by the software automatically marks an institutional liquidity pool. These turning points serve as highly reliable horizontal floors and ceilings for future Price Action.
Upgrading Your Workspace Architecture and Discipline
Sustaining long-term profitability relies entirely on removing human guesswork and psychological bias from your daily chart layout. Automating your structural mapping with an advanced swing script replaces subjective chart drawing with mechanical precision.
The ZZ Orlova V1 script features a highly optimized backend configuration, ensuring smooth real-time plot calculations without causing chart lag or terminal performance drag. The fully customizable parameters dashboard allows you to fine-tune deviation and backstep sensitivities, adapt line colors to match your personal template, and configure instant alert triggers. Integrating this robust technical utility into your platform gives you the visual clarity needed to survive retail whipsaws, manage risk perfectly, and trade in complete harmony with dominant market flow.
4 Downloads
Last Update:
May 20, 2026 17:12 PM
Published:
Jan 18, 2026 14:29 PM
Category: