Precision Pivot Points: The Camarilla Adjustable V2 Indicator MT4
Intraday traders face a constant hurdle when defining daily market boundaries. Relying solely on historical chart patterns can introduce subjective bias, while lagging indicators frequently entry setups late after a major move has already occurred. To capture daily liquidations and expansions with mathematical precision, institutional scalpers rely on specialized floor pivot variations. The Camarilla Adjustable V2 Indicator MT4 automates this mathematical process, drawing systematic intraday Support And Resistance boundaries directly onto your MetaTrader terminal.
Here is an analysis of how this technical tool functions and how to utilize its key ratios to improve your execution.
The Mathematical Engine of Camarilla Pivot Models
Discovered in 1989 by Nick Scott, a successful bond trader, the Camarilla pivot point system operates on a highly reliable market principle: price has an inherent tendency to revert to its mean most of the time. While classic standard pivots calculate wide technical margins, the Camarilla equation focuses tightly on the previous session's range (High, Low, and Close), compressing its calculated lines into highly reactive levels.
The indicator is structurally unique because it uses an exact multiplier sequence to generate eight distinct intraday levels: four support boundaries ($L1$ through $L4$) and four resistance boundaries ($H1$ through $H4$). This "Adjustable V2" variant updates this classic equation by allowing traders to customize lookback timelines and fine-tune calculation models to adapt smoothly to modern, highly volatile currency regimes.
Mapping Inbound Liquidation and Breakout Zones
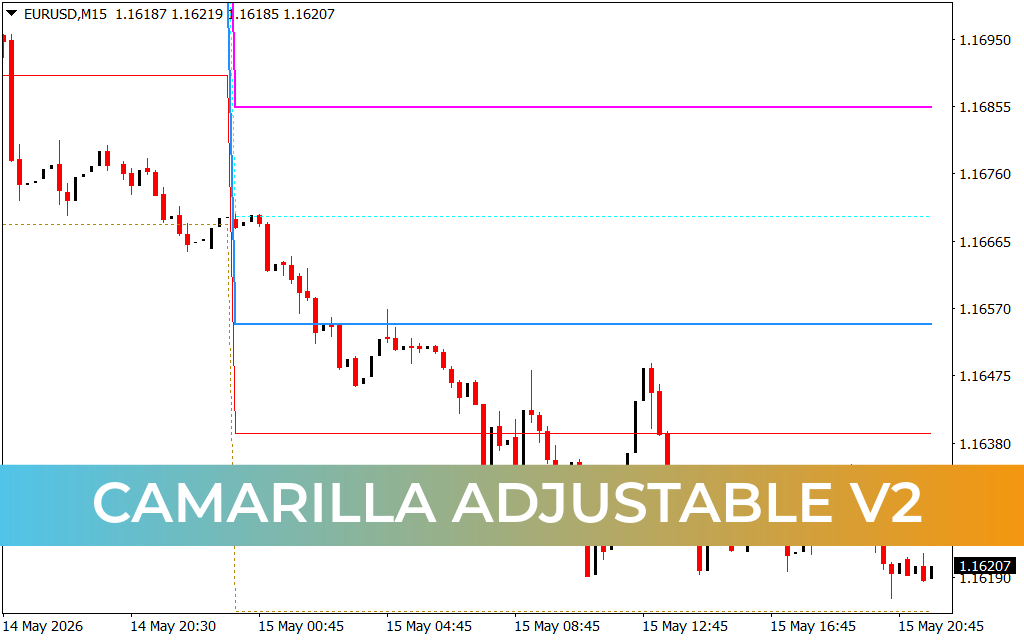
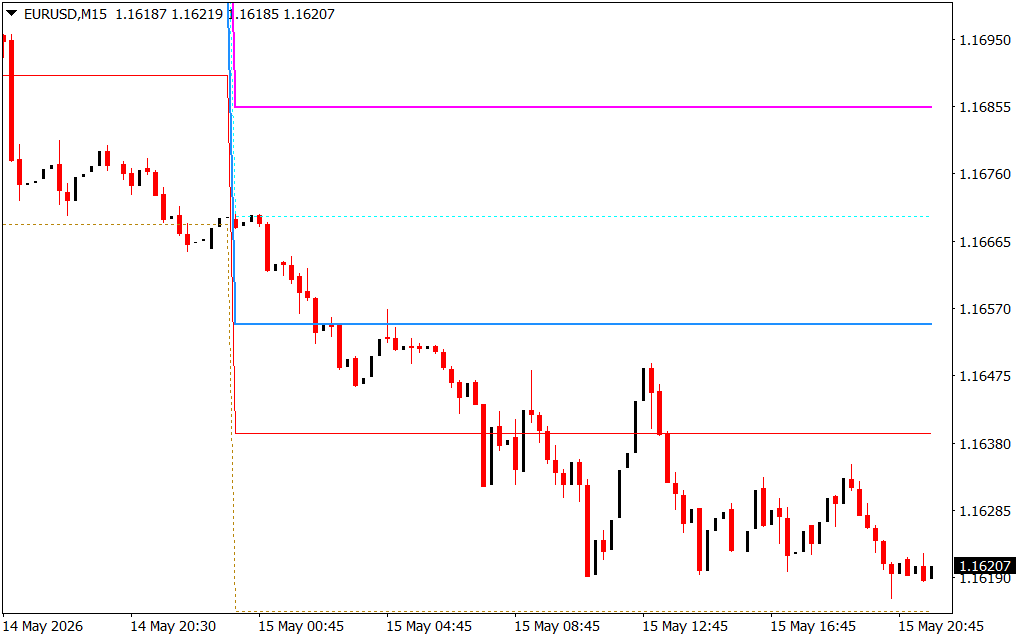
As demonstrated on the EUR/USD M15 chart, the indicator eliminates screen clutter by projecting clean, horizontal institutional floors and ceilings across your workspace:
- The Lower Support Floor (Solid Red Line): The $L3$ floor represents an intraday accumulation zone. When an active liquidation leg extends downward into this boundary, mean-reversion buyers look for price rejection to execute long positions targeting the center pivot.
- The Upper Resistance Ceiling (Solid Blue Line): The $H3$ ceiling acts as a clear distribution ceiling. Intraday short-sellers use this line to look for patterns of exhaustion, shorting the asset back toward the day's structural averages.
- The Breakout Overdrive Levels (Magenta Lines): The $H4$ and $L4$ levels define the ultimate volatility checkpoints. When Price Action breaks completely past the $H3$ or $L3$ limits and crosses these outer boundaries, it confirms that mean reversion has failed and an aggressive institutional breakout is underway.
Professional Strategies for Active Execution Terminals
To extract a true technical edge using the Camarilla Adjustable V2 utility on your trading terminal, implement these active management rules:
- Intraday Mean-Reversion Scalping: When the market opens without strong macro drivers, treat the space between $H3$ and $L3$ as an active trading range. Buy the retests of the red support line and sell the touches of the blue resistance line.
- The Volatility Breakout Trigger: If an explosive news event pushes price completely past the magenta $H4$ resistance or $L4$ support line, abandon your mean-reversion bias. Execute a momentum continuation trade in the direction of the break, as this reveals strong institutional capital flow.
- Automated Risk Management: Use these horizontal coordinates to set hard, objective stop-loss markers. For instance, if you purchase a long reversal at the $L3$ floor, position your protective stop-loss directly below the $L4$ line to maximize your risk-to-reward ratio.gy today.
2 Downloads
Last Update:
May 17, 2026 02:24 AM
Published:
Jan 20, 2026 22:33 PM
Category: