Mastering Trend Retention: The Chandelier Exit MT4 Indicator Explained
One of the most profound challenges in systematic trend-following is not finding a valid entry point, but rather knowing exactly when to exit a highly profitable position. Closing a position too early leaves significant capital on the table, while holding on too long can cause you to watch your hard-earned open equity vanish during a violent Trend Reversal. The Chandelier Exit MT4 Indicator provides a mathematical solution to this dilemma, hanging an adaptive, volatility-based trailing stop over Price Action to maximize your trend retention.
Here is a breakdown of how this classic technical utility operates and how to use it to protect your trading capital.
The Mathematics of Volatility-Based Trailing Stops
Developed by legendary quantitative analyst Chuck LeBeau and popularized by Alexander Elder, the Chandelier Exit relies on the Average True Range ($ATR$) to determine stop placement. Instead of tracking price via fixed pip distances or arbitrary moving averages, it calculates current market volatility to establish logical technical breathing room.
The indicator determines the highest high or lowest low over a designated lookback period (e.g., 22 bars) and subtracts or adds a multiple of the $ATR$ (typically $3.0$). Because it scales dynamically with the market's true statistical range, the tracking bands tighten during low-volatility compressions and widen during major expansions, preventing you from being prematurely shaken out by normal market noise.
Reading the Indicator Structure on the Chart
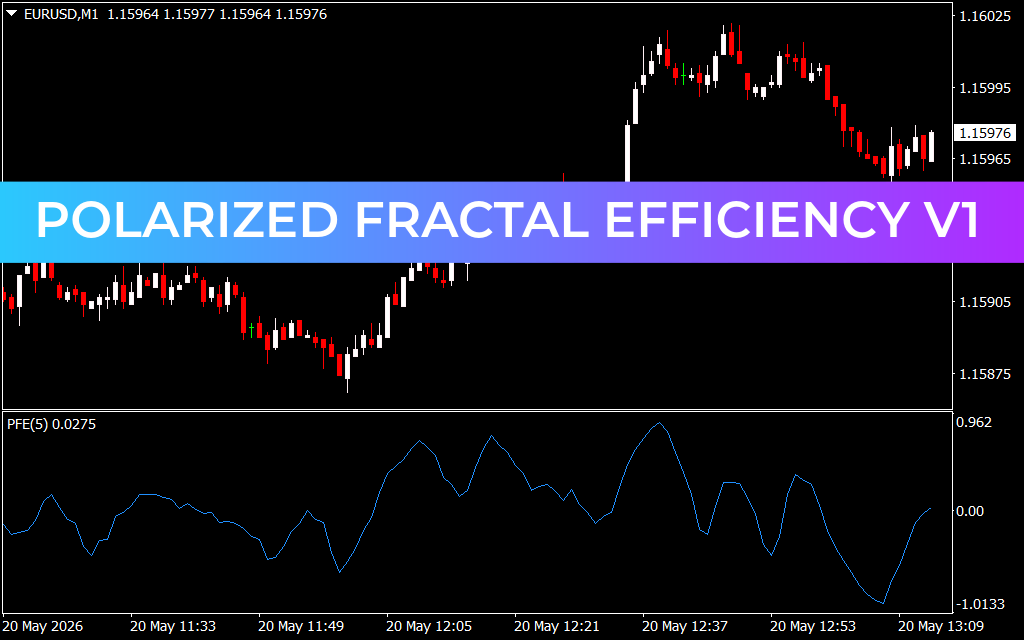
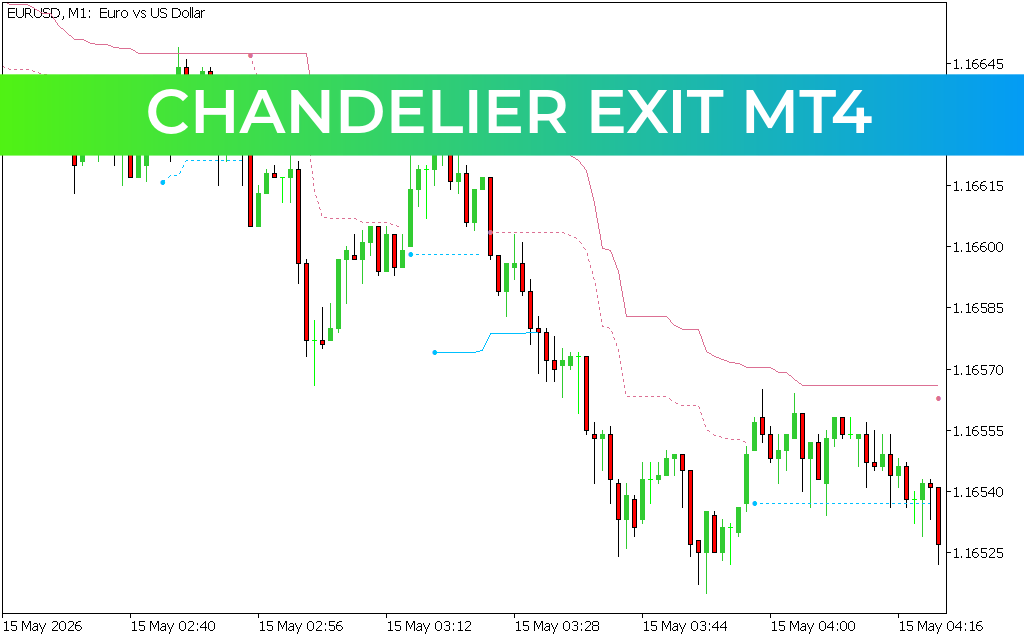
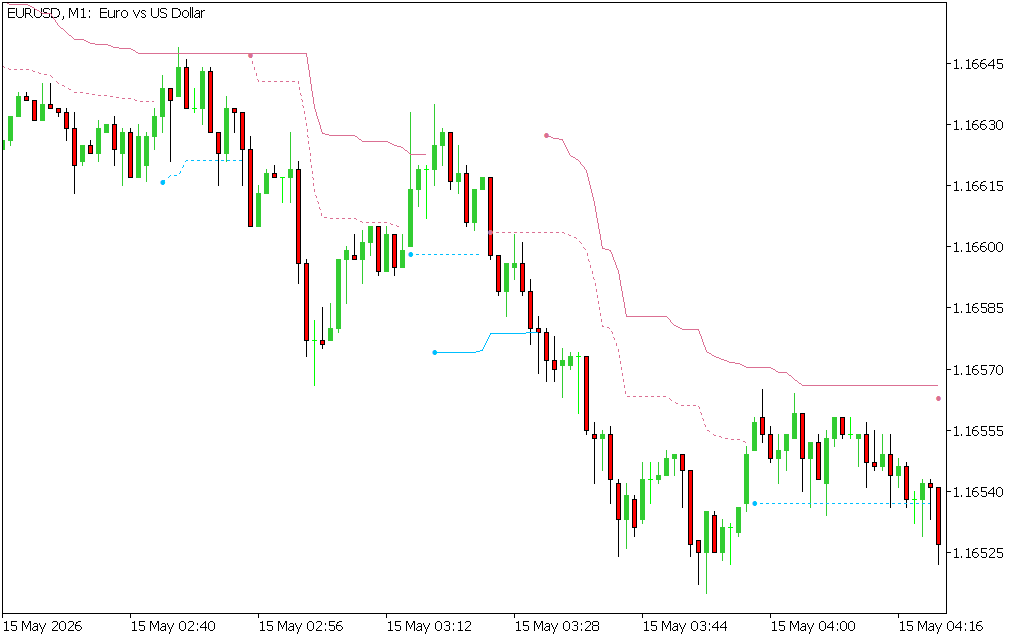
As displayed on the EUR/USD M1 chart, the Chandelier Exit simplifies risk tracking by providing an intuitive, color-coded trailing framework directly on the price candlesticks:
- The Bearish Trailing Ceiling (Pink Lines): When a downward trend is dominant, the indicator plots a stepped pink line directly above the price bars, starting with a distinct pink dot at structural pivot points. This line serves as an automated overhead resistance ceiling, tracking lower as the market falls.
- The Bullish Trailing Floor (Blue Lines): Conversely, when buyers take control of the market, the indicator flips underneath the candles as a stepped blue line. This acts as a dynamic support floor that climbs continuously alongside the ascending price action.
- The Volatility Band Midpoint: The dashed lines between the major structural boundaries highlight the internal volatility shift, allowing scalpers to gauge the immediate micro-momentum within a 1-minute or 5-minute trading window.
When an asset is in a powerful markdown phase, price candles remain firmly capped beneath the stepped pink line, indicating strong institutional selling pressure.
Professional Risk Management Strategies
To maximize the performance of the Chandelier Exit on your MetaTrader 4 terminal, implement these structured execution guidelines:
- Objective Exit Discipline: Treat the solid colored lines as absolute exit triggers. If you are trailing a short trade and a candle closes completely above the pink line, exit the position immediately without hesitation.
- Filtering Counter-Trend Headwinds: Use the tool as a strict trend filter. If the Chandelier Exit is printing a pink ceiling on your execution chart, restrict your trading system to taking short setups exclusively.
- Aligning with Higher Timeframes: For maximum reliability, align your lower-timeframe scaling with a higher-timeframe trend anchor. If the H1 chart shows a strong bullish blue floor, use the lower-timeframe Chandelier pullbacks to time highly efficient, tight-risk long entries.
1 Download
Last Update:
May 17, 2026 02:03 AM
Published:
Jan 20, 2026 22:51 PM
Category: