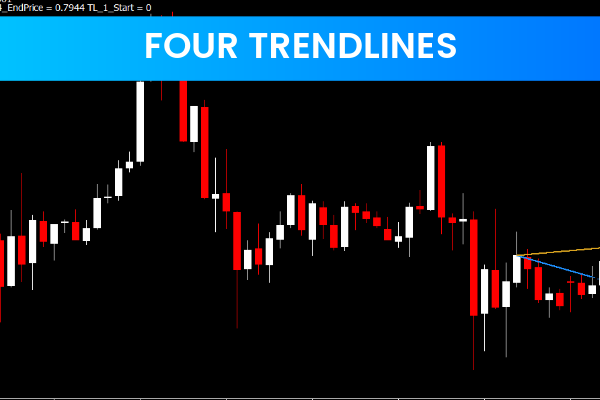
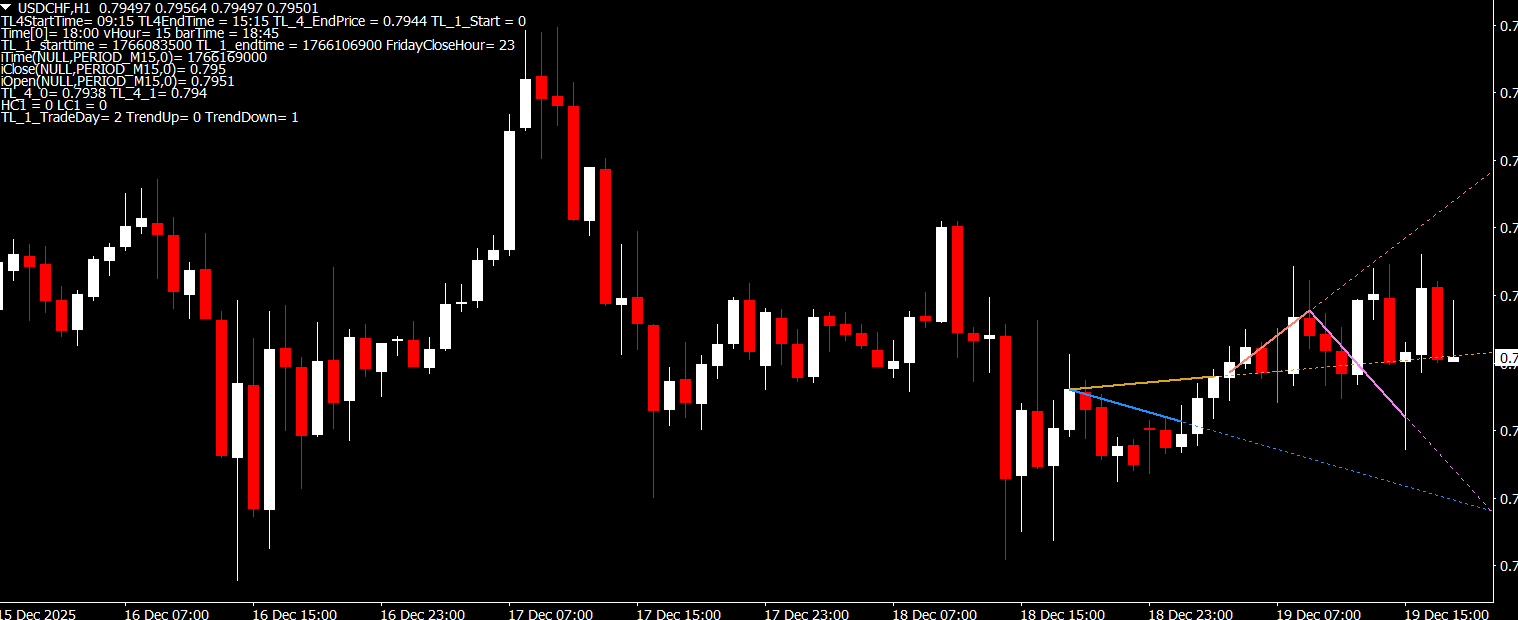
The Four Trendlines Indicator MT4 is a popular and reliable free Forex Indicator for the MetaTrader 4 platform. It is specifically designed to help traders identify key Support And Resistance levels with clarity and accuracy. By plotting four dynamic trendlines directly on the chart, this indicator allows traders to better understand Market Structure and price behavior.
Support and resistance levels play a critical role in technical analysis. The Four Trendlines Indicator simplifies this process by automatically drawing trendlines, reducing manual chart work and helping traders focus on decision-making rather than analysis complexity. It is suitable for both beginner and experienced traders and can be used across multiple trading styles.
What Is the Four Trendlines Indicator
The Four Trendlines Indicator is a technical analysis tool that plots four distinct trendlines on the chart. These trendlines act as dynamic support and resistance zones, showing where price is likely to react, stall, or reverse.
Unlike manually drawn trendlines, this indicator adjusts automatically as Price Action evolves. This makes it a valuable tool for traders who want consistent and objective support and resistance levels without constantly redrawing lines.
How the Four Trendlines Indicator Works
The indicator analyzes historical price data and identifies important swing highs and lows. Based on this information, it plots four trendlines that reflect:
Upper resistance levels
Lower support levels
Intermediate trend boundaries
Potential reversal zones
As price moves, the trendlines adjust in real time, giving traders a clearer picture of the current market structure. When price approaches or breaks one of these lines, it can signal a potential trend continuation or reversal.
Key Features of Four Trendlines Indicator MT4
Free Forex indicator for MT4
Automatically plots four trendlines
Identifies dynamic support and resistance
Helps detect trend reversals
Customizable trendline appearance
Works on all currency pairs
Compatible with all timeframes
Easy to use for beginners and professionals
How to Use the Indicator in Forex Trading
The Four Trendlines Indicator can be applied in several effective trading strategies:
Support and Resistance Trading
Traders can look for buy opportunities near support trendlines and sell opportunities near resistance trendlines.
Trend Reversal Identification
When price breaks a trendline and fails to continue in the same direction, it may indicate a possible Trend Reversal.
Entry and Exit Planning
Trendlines can be used as reference points for setting stop losses and take profit levels, improving risk management.
For higher accuracy, traders often combine this indicator with momentum indicators, candlestick patterns, or volume analysis.
Best Timeframes and Trading Styles
The Four Trendlines Indicator works efficiently on:
Lower timeframes for scalping
Medium timeframes for day trading
Higher timeframes for swing trading
Because it adapts to price action, it remains effective across signal different market conditions, including trending and ranging markets.
Advantages and Limitations
Advantages
Reduces manual trendline drawing
Clear visual representation
Improves market structure analysis
Saves time during technical analysis
Limitations
Should be confirmed with other indicators
False breakouts can occur in volatile markets
Why Download from IndicatorForest.com
At IndicatorForest.com, we offer trusted and tested MT4 indicators designed to help traders make informed decisions. The Four Trendlines Indicator MT4 is an excellent tool for traders who rely on support, resistance, and trend analysis to find high-probability trading opportunities.
👉 Visit IndicatorForest.com to download this indicator and explore a wide collection of professional Forex trading tools.
FAQ
2 Downloads
Published:
Dec 19, 2025 12:37 PM
Category: