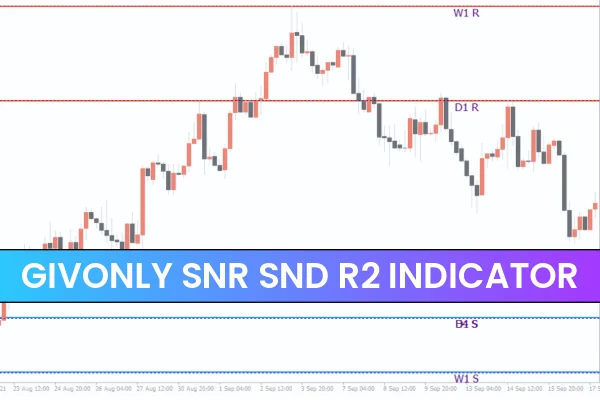
The Givonly SnR SnD R2 indicator for MT4 automatically plots hourly, daily, and weekly support and resistance levels on the current chart. By displaying higher-timeframe Market Structure on lower timeframes, the indicator helps forex traders identify major reaction zones with ease.
In addition, the indicator marks potential Supply And Demand zones, which are widely considered some of the strongest reversal areas in technical analysis. These levels often lead to high-probability trades with minimal risk exposure. The name “SnR SnD R2” stands for Support And Resistance and Supply and Demand.
The indicator works seamlessly on all intraday timeframes as well as daily, weekly, and monthly charts. Because support and resistance form the foundation of Price Action analysis, the Givonly SnR SnD R2 indicator is especially helpful for beginners. New traders can clearly see major levels plotted on their charts, allowing them to develop confidence and consistency in their trading approach.
Advanced traders can take the indicator even further. By combining the higher-timeframe support and resistance with concepts like breakouts, trend lines, channels, divergences, and confluence strategies, they can build sophisticated trading setups based on market structure.
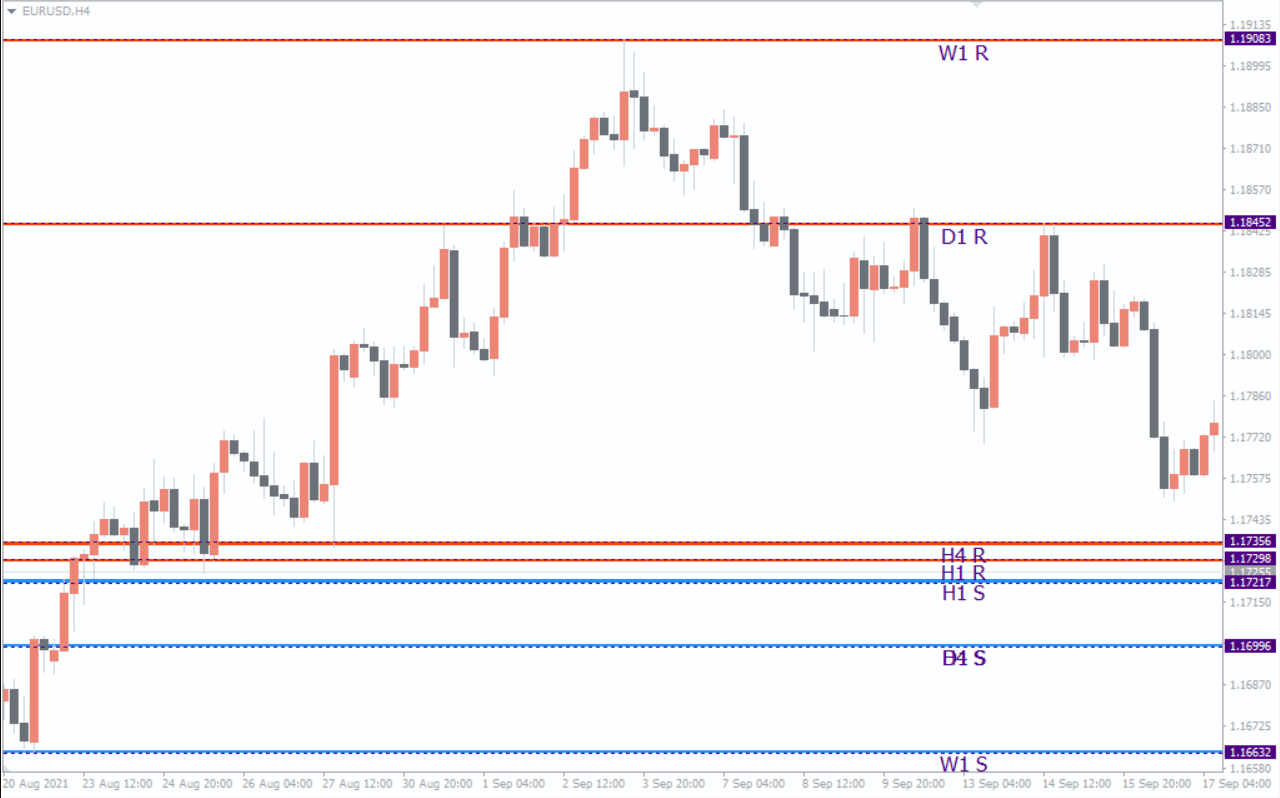
Givonly SnR SnD R2 Indicator for MT4 – Trading Setup
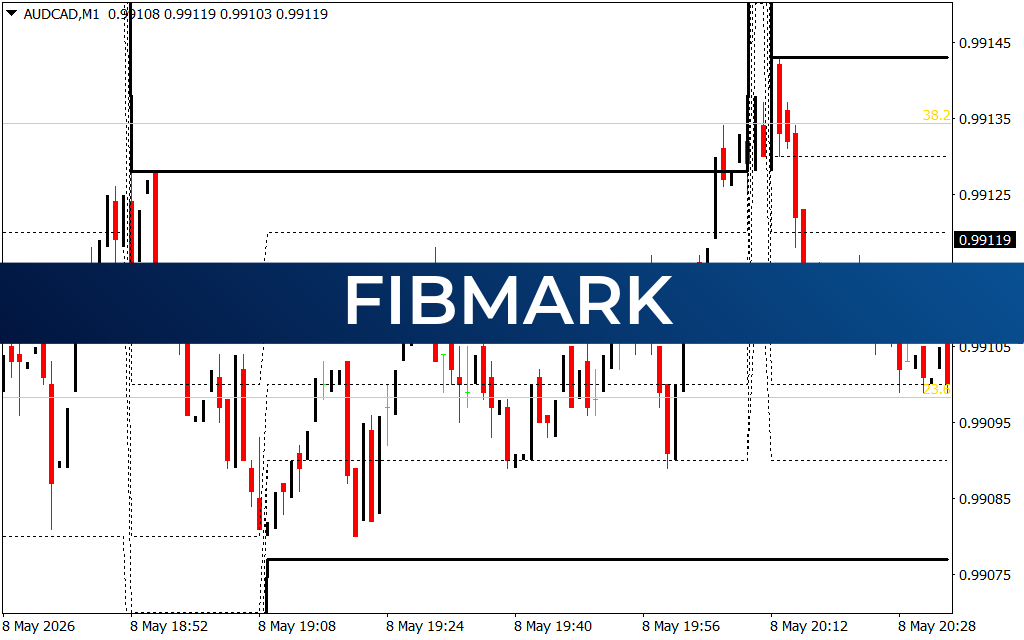
The EURUSD H4 chart example shows how the indicator plots key support and resistance levels automatically. Support levels appear in BLUE, while resistance levels appear in RED. The tool displays Hourly, H4, Daily, and Weekly levels simultaneously so traders always know where price is likely to react.
A simple and effective way to trade these levels is to look for buying opportunities at support. Traders can place a stop loss below the previous swing low and aim for the next resistance level as a take-profit target.
Conversely, when price reaches a resistance line, sell positions can be considered. The nearest support level serves as an ideal target.
Support and resistance levels are strongest when multiple timeframes align at the same price. The more times a level has been tested and respected, the more powerful it becomes.
For added confluence, traders can combine these levels with Fibonacci retracements, continuation patterns, or breakout strategies. When Fibonacci levels line up with established support and resistance, the probability of a successful trade increases significantly.
Conclusion
The Givonly SnR SnD R2 indicator for MT4 is a highly effective tool that automatically plots support, resistance, and supply-demand levels. This allows traders to focus on executing their strategies instead of manually marking levels. With its multi-timeframe capability and clean visualization, the indicator benefits both beginners and advanced traders. It is also free to download and easy to install, making it a valuable addition to any forex trader’s toolkit.
FAQ
12 Downloads
Published:
Nov 28, 2025 10:07 AM
Category: