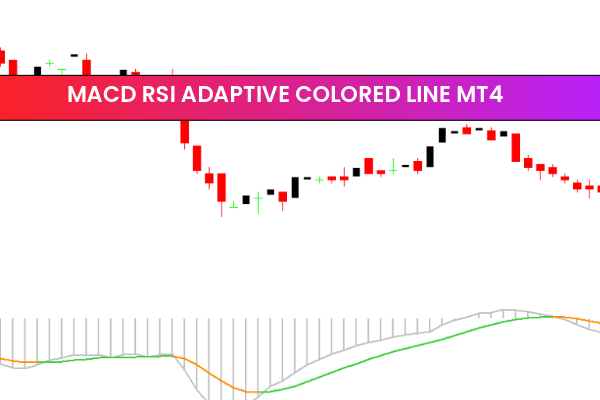
The MACD RSI Adaptive Colored Line Indicator is a popular and free Forex Indicator for MetaTrader 4 (MT4) that combines two of the most widely used technical indicators: Moving Average Convergence Divergence (MACD) and Relative Strength Index (RSI).
This indicator is designed to help traders analyze trend direction, trend strength, and market momentum in a clear and visually intuitive way. Its adaptive nature allows it to automatically adjust to changing market conditions, making it suitable for both beginner and advanced traders.
How the MACD RSI Adaptive Colored Line Indicator Works
The indicator merges MACD and RSI calculations into a single adaptive system. Instead of using fixed parameters, it dynamically adjusts its sensitivity based on market volatility and price behavior.
The indicator displays:
A colored trend line
MACD histogram values
RSI momentum information
This combination allows traders to quickly assess whether the market is trending, ranging, or preparing for a reversal.
Colored Trend Line Explained
One of the most useful features of this indicator is the adaptive colored line, which visually represents market direction:
Green line – Bullish trend
Red line – Bearish trend
Color changes often signal trend shifts or momentum changes, making it easier to spot potential trade setups without complex analysis.
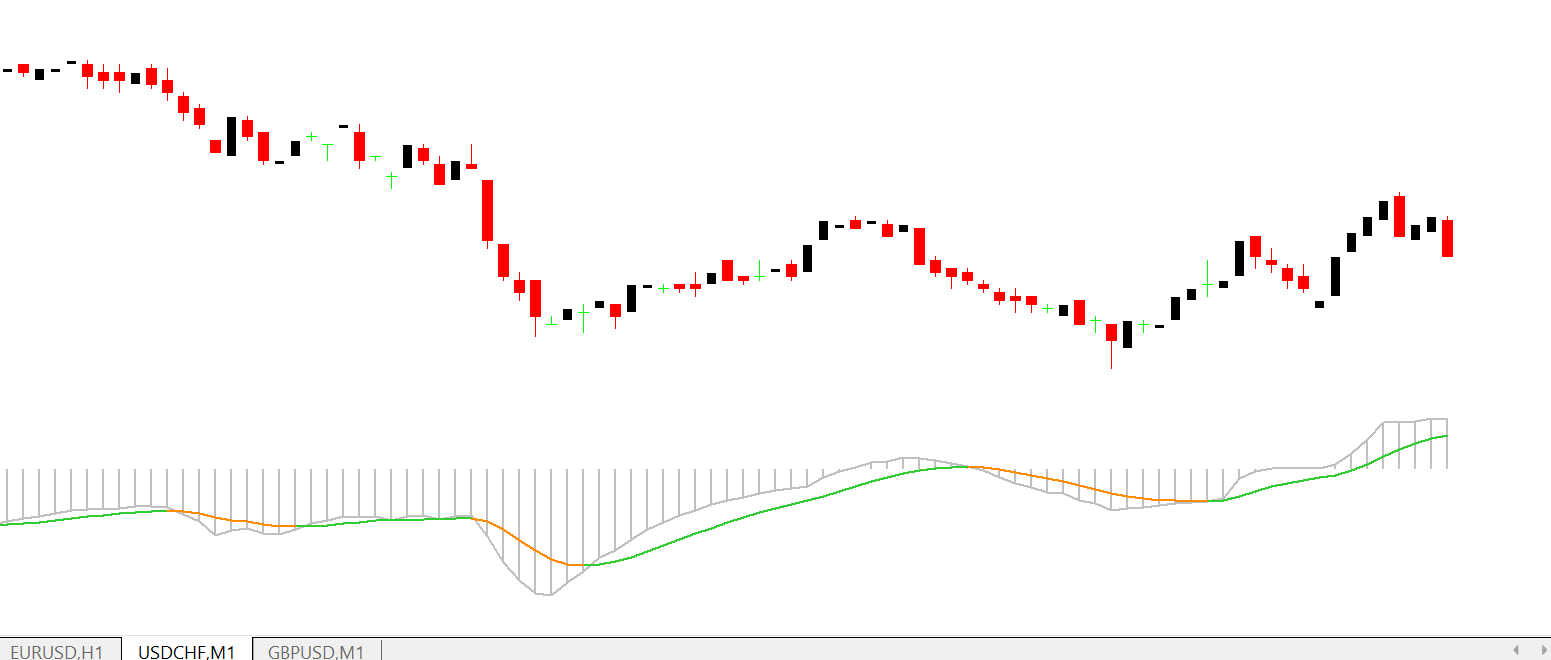
MACD and RSI Integration
MACD Component
Identifies trend direction and momentum
Helps detect Trend Continuation or weakening
Useful for spotting momentum shifts
RSI Component
Identifies overbought and oversold conditions
Confirms strength or weakness of the trend
Helps filter false MACD signals
By combining both indicators, the MACD RSI Adaptive Colored Line provides more reliable signals than using MACD or RSI alone.
Entry and Exit Signal Strategy
Buy Signals
Colored line turns green
MACD histogram shows bullish momentum
RSI confirms upward strength
Sell Signals
Colored line turns red
MACD histogram shows bearish momentum
RSI confirms downward pressure
Traders can further improve accuracy by combining signals with Support And Resistance levels or higher-timeframe trend confirmation.
Key Features
Combines MACD and RSI into one indicator
Adaptive settings adjust automatically to market conditions
Colored trend line for instant trend recognition
MACD and RSI histogram display
Works on all timeframes
Compatible with all currency pairs
Easy to read and beginner-friendly
Free to download and use on MT4
Customization Options
Although adaptive, the indicator allows traders to:
Adjust sensitivity levels
Modify color schemes
Fine-tune momentum filtering
Match the indicator to their trading style
This makes it suitable for Scalping, day trading, and swing trading strategies.
Trading Benefits
Using the MACD RSI Adaptive Colored Line Indicator helps traders:
Identify trend direction faster
Avoid low-probability trades
Improve entry and exit timing
Reduce indicator clutter
Combine trend and momentum in one tool
It is especially effective in trending markets and during strong momentum phases.
Best Practices for Use
For optimal results:
Confirm signals with higher timeframes
Avoid trading during low-volatility sessions
Combine with Price Action or structure analysis
Always apply stop-loss and risk management
The indicator performs best as part of a complete Forex trading system, not as a standalone signal generator.
Who Should Use This Indicator
Trend-following traders
Momentum traders
Beginners learning MACD and RSI
Advanced traders seeking confirmation
MT4 users looking for clean, adaptive indicators
Final Thoughts
The MACD RSI Adaptive Colored Line Indicator for MT4 is a powerful and visually intuitive trading tool that combines trend detection and momentum analysis into one adaptive system. Its colored signals and automatic adjustments make it a reliable choice for Forex traders looking to improve accuracy and reduce noise.
👉 Visit IndicatorForest.com to download the MACD RSI Adaptive Colored Line Indicator for free and explore more professional MT4 Forex indicators.
Published:
Jan 06, 2026 14:57 PM
Category: