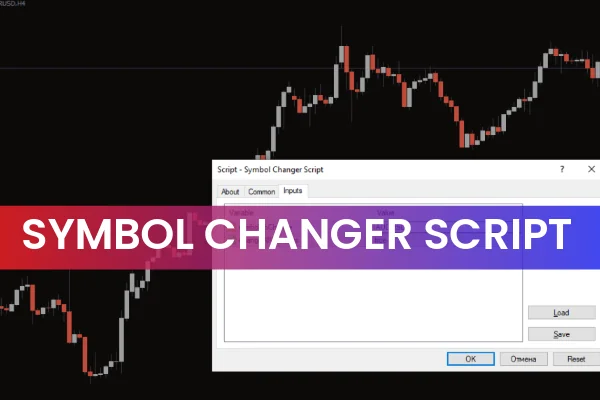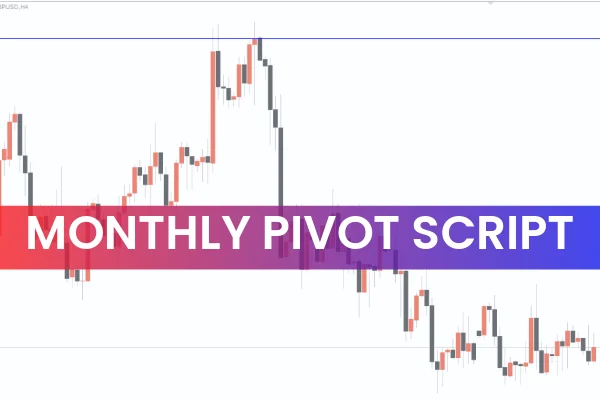
The Monthly Pivot Script for MT4 is an automatic price-level plotting tool designed to display long-term Support And Resistance zones directly on your charts. Built specifically for MetaTrader 4, this script generates monthly pivot lines on any timeframe, allowing traders to see the bigger picture while analyzing Market Structure and potential trading opportunities.
Understanding price levels is a core skill for every technical trader. Regardless of whether you are a trend follower, reversal trader, swing trader, or day trader, support and resistance are essential components of chart analysis. After confirming the market trend—bullish or bearish—you must determine where price might react, stall, or reverse. The Monthly Pivot Script helps you quickly identify these zones with minimal effort.
Why Monthly Pivot Levels Matter
Monthly pivot levels represent significant historical price areas derived from the previous month’s price movement. Because these levels are long-term, they tend to hold stronger influence over market behavior than short-term pivot points.
These pivot zones can indicate:
Long-term support levels
Major resistance blocks
Potential reversal areas
Trend continuation zones
Breakout or breakdown levels
Many professional traders rely on monthly pivots to filter out noise from lower timeframes. The script allows you to evaluate whether the price is respecting or rejecting a key pivot line and to gauge the strength of a trend.
How to Determine Buy-Sell Levels Using the Monthly Pivot Script for MT4
Monthly Pivots as Support and Resistance
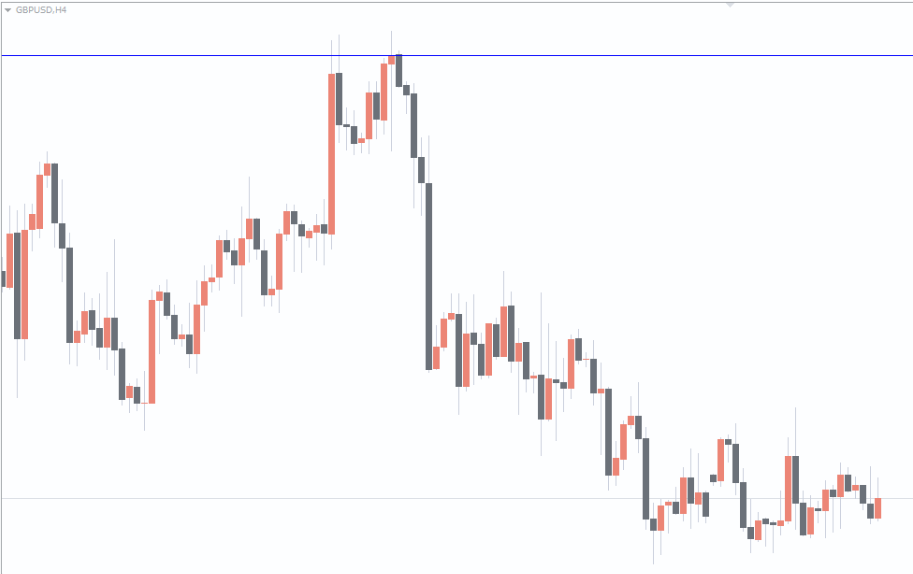
Monthly pivot levels naturally act as strong support and resistance on forex, stocks, indices, and commodities. Price often reacts at these zones—either reversing sharply or initiating powerful breakout moves.
For example, in the GBPUSD 4-hour chart referenced above, price attempted twice to break above the monthly pivot line. Both attempts failed, creating a double top pattern, which is a classic bearish reversal signal. The inability to break through the resistance validated the pivot as a strong level.
Once the price broke below the consolidation structure, a significant bearish trend followed. This example highlights two key concepts:
Monthly pivots can confirm potential reversals
Monthly pivots identify reliable breakout levels
If price had successfully broken above the pivot and retested the same level as support, it would have suggested a potential bullish continuation.
Long-Term Focus With Limited But Strong Signals
Because the Monthly Pivot Script focuses on long-term price levels, it does not trigger constant signals. Instead, it highlights fewer—but more impactful—reaction zones. These areas often align with institutional liquidity, accumulation, or distribution zones, making them crucial for:
Intraday traders identifying high-probability reaction zones
Swing traders planning long-term entries
Trend traders validating continuation setups
Counter-trend traders spotting reversal opportunities
While the script does not generate trade signals, combining pivot levels with Price Action—such as candlestick patterns, structure breaks, or chart formations—can help traders form highly accurate buy/sell strategies.
How to Apply the Monthly Pivot Script in MT4
Installing and applying the script is straightforward:
Download the script and place it inside the Scripts folder in MetaTrader 4.
Refresh or restart MT4.
Drag the script onto any chart and timeframe.
The monthly pivot lines automatically appear, showing you long-term support and resistance levels.
This gives traders instant clarity on key levels without manually calculating pivots.
Conclusion
The Monthly Pivot Script for MT4 is one of the simplest yet most valuable price-level tools available for MetaTrader 4 users. It outlines essential long-term support and resistance zones that help traders identify high-probability buy and sell setups. While it does not produce trade signals on its own, pairing monthly pivot levels with reliable price action analysis can dramatically improve the accuracy of your entries.
You can download the script for free at IndicatorForest.com and start using monthly pivot levels to refine your trading strategy.
FAQ
1 Download
Published:
Dec 04, 2025 02:10 AM
Category: