Master Market Momentum with the Ssm Velocity Floating Level Indicator
In the fast-paced world of Forex trading, identifying the strength and direction of a trend is the difference between a winning streak and a drawdown. The Ssm Velocity Floating Level indicator is a sophisticated technical tool designed for traders who demand more than just basic oscillators. By combining momentum tracking with adaptive volatility levels, this indicator provides a nuanced view of Price Action that static tools simply cannot match.
Understanding the Velocity Advantage
Most momentum indicators use fixed overbought and oversold levels (like 70 and 30 in RSI). However, markets are dynamic; a level that signifies "exhaustion" in a quiet market might be "just the beginning" during a high-volatility breakout. The Ssm Velocity Floating Level solves this by utilizing dynamic floating levels.
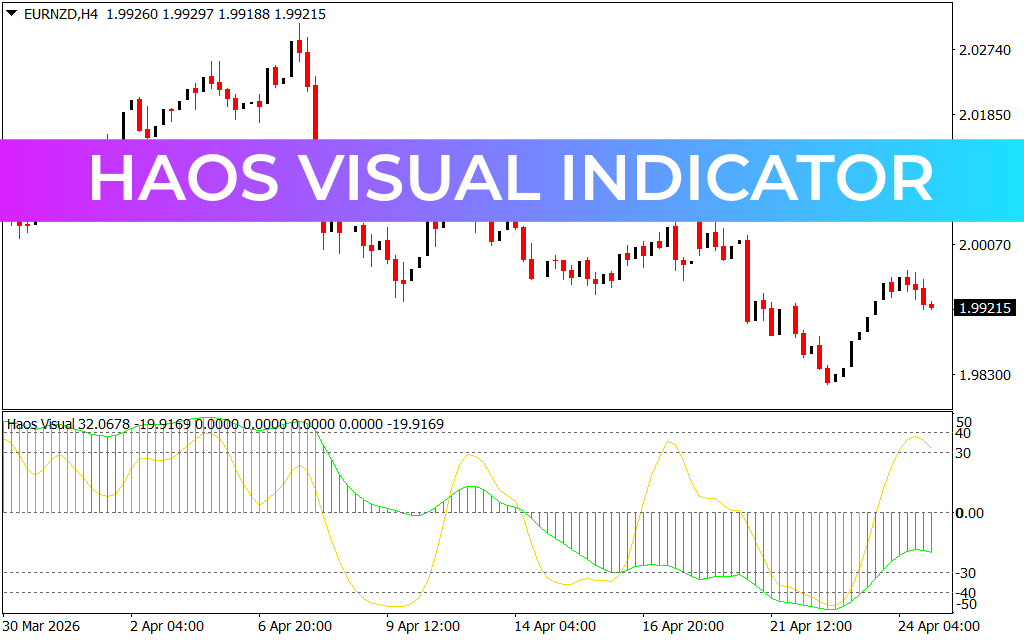
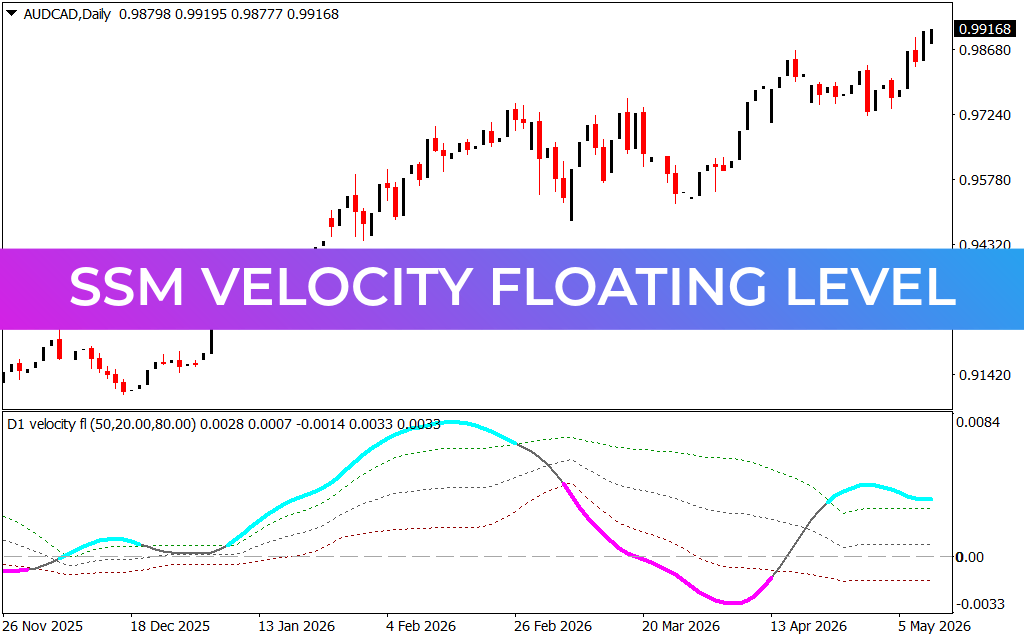
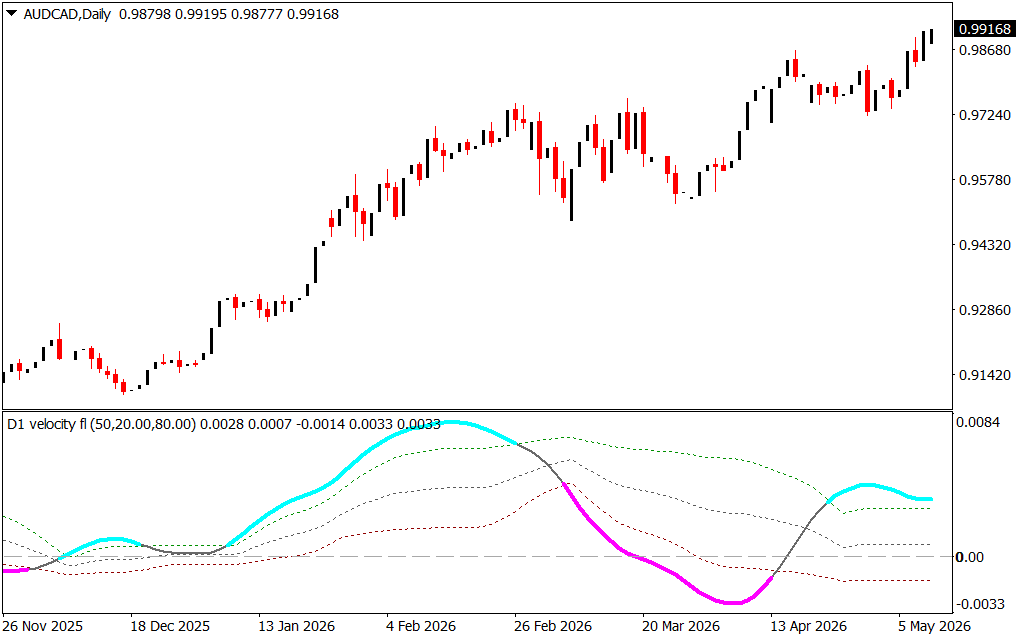
As seen in the AUD/CAD daily chart, the indicator consists of a central signal line—which changes color from cyan (bullish velocity) to magenta (bearish velocity)—and a set of adaptive dashed envelopes. These envelopes expand and contract based on recent market behavior, ensuring that your signals are always contextualized against current market conditions.
Key Features and Functionality
- Color-Coded Momentum: The bold signal line offers instant visual feedback. When the line turns cyan and moves upward, it signals accelerating bullish momentum. Conversely, a magenta shift indicates a dominant bearish surge.
- Adaptive Floating Levels: The dashed boundary lines act as flexible Support And Resistance for momentum. When the velocity line pierces the upper green floating level, it indicates an extreme trend phase, often preceding a strong continuation or an eventual mean reversion.
- Zero-Line Crossovers: The center line (0.00) acts as the ultimate pivot. A crossover from negative to positive territory serves as a foundational "buy" signal, confirming that the bulls have regained control of the underlying trend.
- Divergence Spotting: By comparing price peaks to the peaks of the Ssm Velocity line, traders can identify bearish or bullish divergences, providing an early warning system for potential trend reversals.
Strategy Integration
The Ssm Velocity Floating Level is exceptionally effective when used as a trend-confirmation tool. For instance, if price action breaks above a resistance level on the main chart, a corresponding cyan surge in the Velocity indicator confirms the breakout has the "fuel" to sustain the move.
It also excels in "buying the dip." In an established uptrend, a trader might wait for the velocity line to retreat toward the zero line or the lower floating levels before turning cyan again, signaling a high-probability entry point at a discount.
2 Downloads
Last Update:
May 11, 2026 21:11 PM
Published:
Jan 24, 2026 13:45 PM
Category: