If you are a technical forex trader, you have likely encountered the term engulfing pattern (eng-pattern). If not, don’t worry — the concept is simple but powerful. An engulfing pattern forms when one candlestick completely covers the previous one. This pattern often signals a potential reversal and appears on both overall trends and counter-trends.
For traders who rely heavily on Price Action, tools such as the Forex Reversal Indicator and the Super Arrow Indicator also complement the logic behind engulfing setups.
Engulfing Indicator for MT4 – Free Download
The Engulfing Indicator for MT4 automatically scans the charts and highlights bullish and bearish engulfing candlestick formations. This saves traders from manually searching for patterns and offers a faster, more precise way to spot reversal points.
What makes the indicator even more useful is its ability to distinguish between bullish engulfing patterns and bearish engulfing patterns, labeling them clearly on the chart.
From practical experience, installation is straightforward. After dropping the file into the MT4 indicators folder and refreshing the platform, the indicator loads instantly. Once attached, the arrows appear immediately on historical data, making quick visual backtesting easy. Adjusting the signal sensitivity in the settings also makes it adaptable to any trading style or timeframe.
This indicator is suitable for both beginners and advanced traders. It works on all currency pairs and all timeframes, and the customizable settings allow traders to refine it to their personal preferences.
Discover More
MT5 • MT4 • MetaTrader 5 • Algo Trading • Algorithmic trading • MetaTrader 4 • Automated trading systems • Trading strategy guide • Financial Market News • Metatrader 5 platform
Using the Engulfing Indicator for Trading
Engulfing patterns indicate where market pressure is shifting.
A bullish engulfing pattern reveals strong buying pressure.
A bearish engulfing pattern shows that sellers are overpowering buyers.
The indicator marks these signals as follows:
Blue upward arrow = bullish engulfing
Red downward arrow = bearish engulfing
Your task as a trader is to interpret these arrows and trade accordingly. However, it’s always recommended to use additional confirmation tools such as trend lines, moving averages, or support/resistance zones.
In live trading, combining the engulfing signals with a moving average trend filter significantly reduces false alarms. The indicator is powerful, but it becomes exceptionally reliable when used as part of a confluence-based strategy.
Best Areas to Use the Indicator
This indicator performs best around Support And Resistance zones.
A blue arrow appearing at support provides a strong bullish reversal opportunity.
A red arrow appearing at resistance signals a high-probability bearish move.
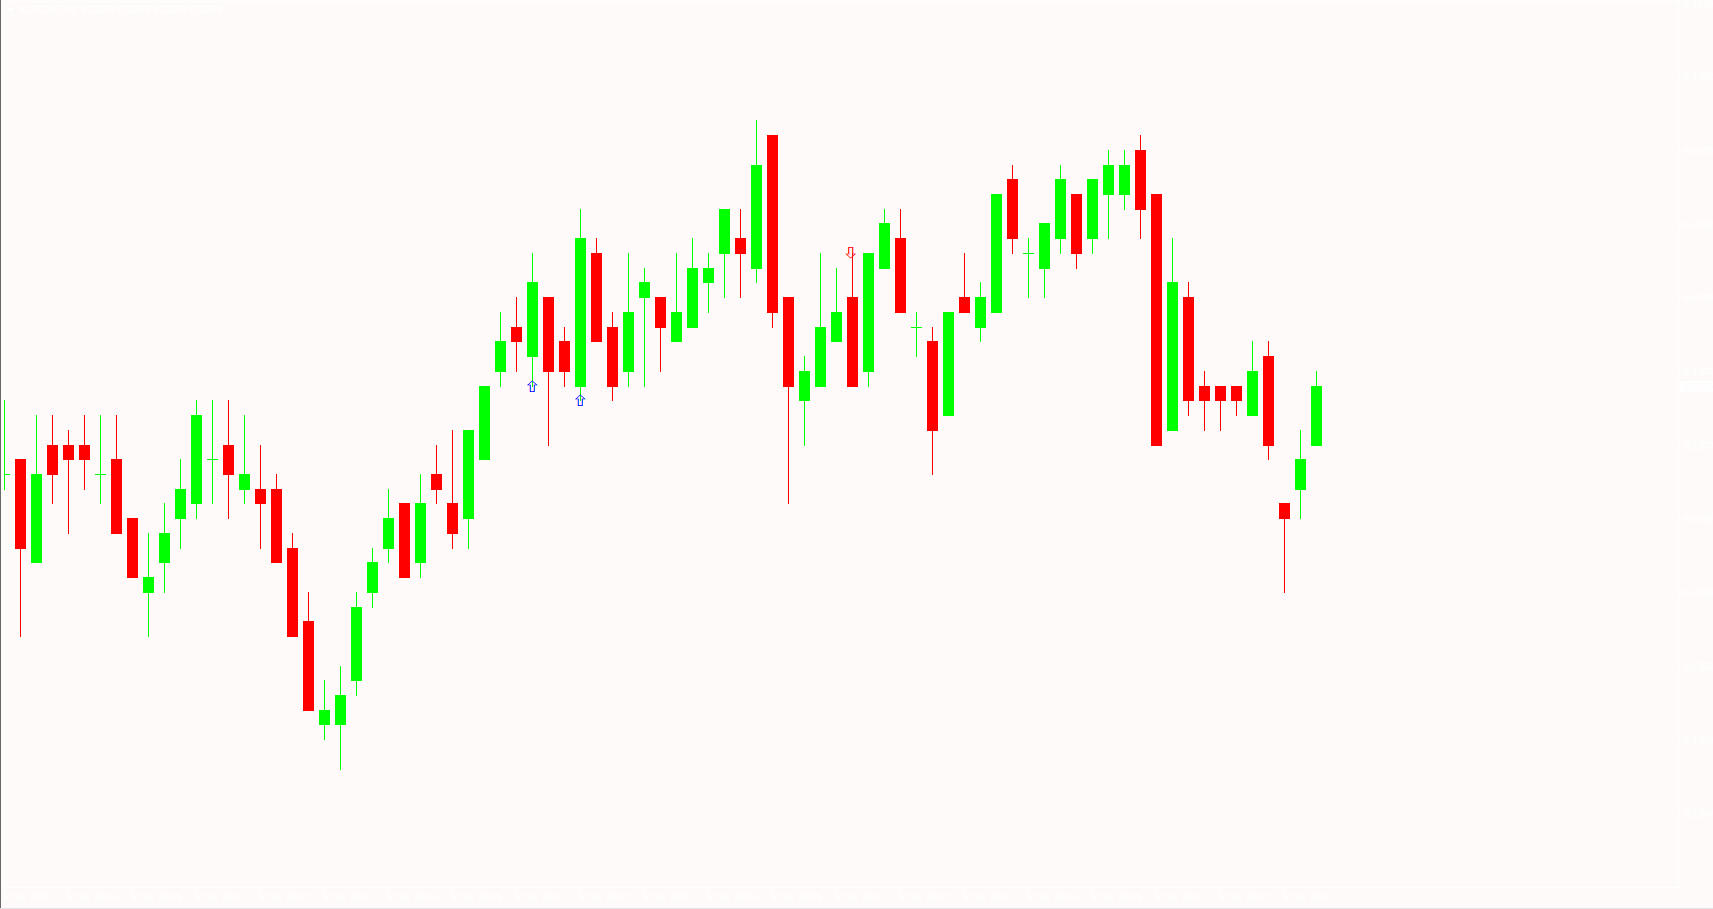
Example from the Chart
The example chart (GBP/AUD) demonstrates how the indicator identifies engulfing setups:
A red arrow appears after a double top — a strong bearish engulfing pattern.
The market reverses sharply downward after the signal.
Later, blue arrows appear at new lows, showing a bullish engulfing pattern and offering potential long entry points.
This illustrates how powerful engulfing setups can be when combined with market structure analysis.
Conclusion
The Engulfing Indicator for MT4 is an excellent tool for traders who rely on candlestick patterns and reversal strategies. With automatic detection, customizable settings, and compatibility with all pairs and timeframes, it brings efficiency and accuracy to your technical analysis. Whether you are a beginner or an experienced trader, this indicator will help you identify high-probability reversal points with confidence.
FAQ
2 Downloads
Published:
Dec 04, 2025 13:47 PM
Category: