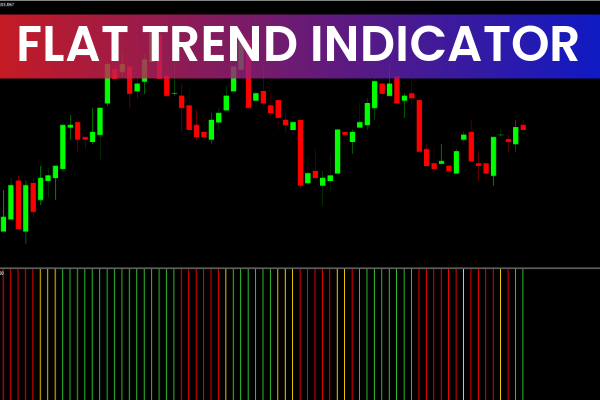
The Flat Trend Indicator for MT4 is a simple yet powerful forex trading tool designed to help traders identify trending and non-trending market conditions with precision. Built as a fusion of three moving averages—fast, medium, and slow—the indicator provides an easy-to-read visual display in a separate window beneath the price chart. Its color-changing histogram makes it ideal for beginners and advanced traders looking for trend clarity without market noise.
The indicator displays three colors depending on the prevailing market direction:
Green for bullish (buy) signals
Red for bearish (sell) signals
Yellow for flat or ranging market conditions
You can also customize the moving average settings to match your personal strategy. Whether you trade forex, CFDs, or indices, this MT4 indicator works well across all markets. It performs exceptionally in Scalping environments, especially on low-spread pairs like EUR/USD and GBP/USD.
How the Flat Trend Indicator Works
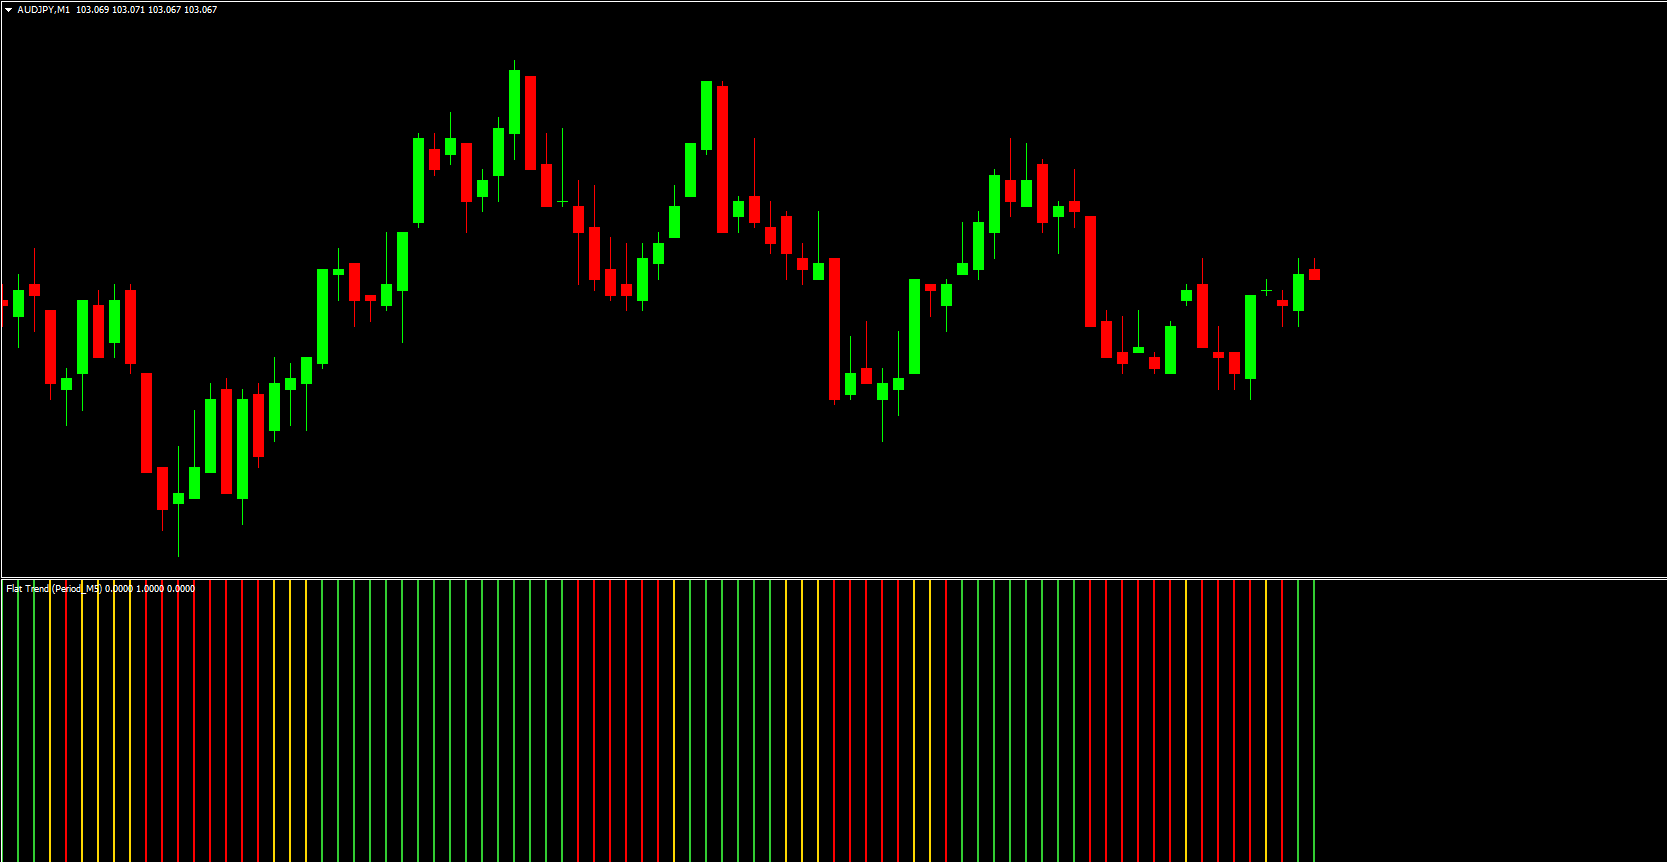
Because it blends several moving averages into one output, the Flat Trend Indicator offers an easy view of Trend Strength and market transitions. Instead of analyzing multiple MAs on the chart, traders can simply observe the histogram colors:
Green bars indicate rising momentum and bullish direction.
Red bars identify bearish pressure and downward movement.
Yellow bars reveal market indecision, consolidation, or flat movement.
This simple color system eliminates confusion and helps traders avoid false signals common in choppy markets.
How to Trade Using the Flat Trend Indicator
Buy Signal
First, watch for yellow bars, which represent consolidation or a ranging market. When the bars shift from yellow to green, a bullish trend is likely forming. This transition is the ideal spot to enter a long position. For even stronger confirmation, combine the indicator with Price Action such as breakouts, bullish candle patterns, or a rising trendline.
Sell Signal
A sell opportunity appears when the bars turn red, signaling bearish momentum. As with buy trades, you can wait for yellow bars to confirm a range before entering a short position. If price action already shows lower highs or bearish pressure, the red-bar shift strengthens the sell setup.
Exit Strategy
For long positions: exit when green bars turn to yellow or red.
For short positions: exit when red bars turn yellow or green.
This ensures you lock in profits before the market reverses.
Chart Example Explanation
On a EUR/GBP chart, a shift from yellow to green triggered a buy signal that resulted in a rise of over 100 pips. Later, a shift from green to yellow and then red confirmed a sell signal, resulting in another profitable move of more than 50 pips. These examples highlight the indicator’s strength in capturing early trend movements.
Why Traders Use the Flat Trend Indicator
Easy-to-read color-based system
Works across all market conditions
Great for Trend Following and scalping
Helps avoid trading during flat or uncertain markets
Effective for beginners and experienced traders
The Flat Trend Indicator for MT4 helps traders understand market direction at a glance. Simply follow the color transitions: buy when green, sell when red, and stay out when yellow. With proper practice, this indicator becomes a reliable tool for improving trade accuracy and timing.
Call-to-Action
Download the Flat Trend Indicator for MT4 today from IndicatorForest.com and start identifying clear buy and sell signals instantly.
FAQ
2 Downloads
Published:
Dec 05, 2025 13:52 PM
Category: